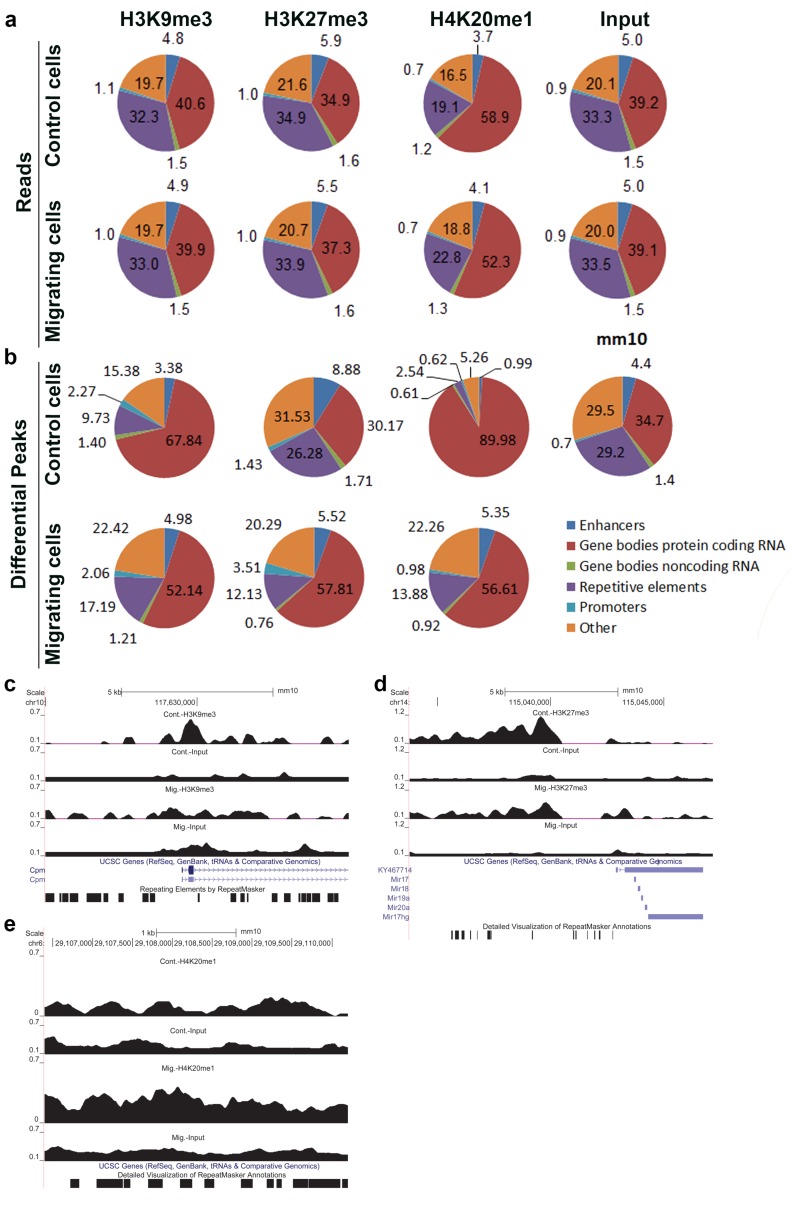
Figure 2.
Relative distribution of ChIP-seq signal across various genomic elements in control and migrating cells. (a,b) The relative distribution of ChIP-seq reads (a) and ChIP-seq differential peaks (b) across the indicated genomic elements was calculated for the input and the three heterochromatin markers in control cells and in migrating cells. (c–e) UCSC browser shots of H3K9me3, H3K27me3, and H4K20me1, respectively.

