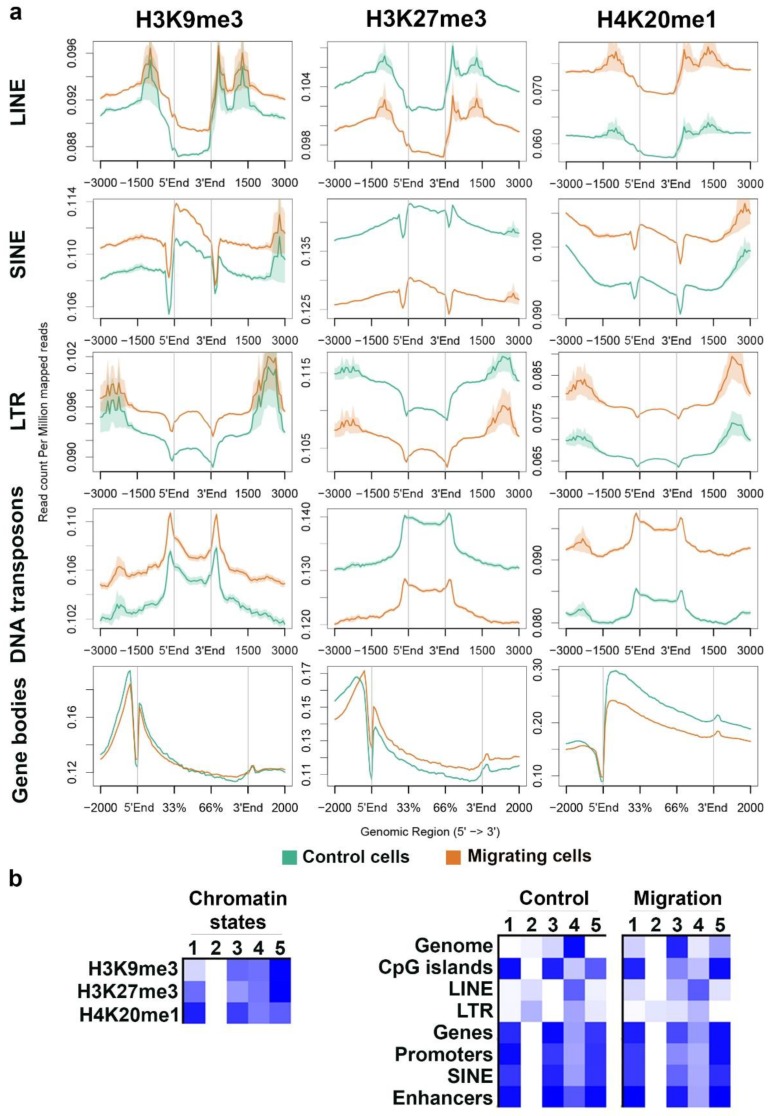
Figure 3.
Distinct and combinatorial pattern of heterochromatin markers over genomic elements. (a) Distribution of H3K9me3, H3K27me3, and H4K20me1 ChIP-seq signals in control cells (green line) and in migrating cells (orange line) across gene bodies and the repetitive elements LINE (n = 671,156), SINE (n = 682,126), LTR (n = 646,284), and DNA transposons (n = 79,756). In each graph, the region between 5’End and 3’End represents the analyzed element. (b) Five combinatorial chromatin states were defined using the three heterochromatin markers. The left panel describes the chromatin states as represented by the emission coefficients in ChromHMM model; the right panel describes the relative enrichment of states coverage across the whole genome and over different genomic regions, in control and migrating cells.

