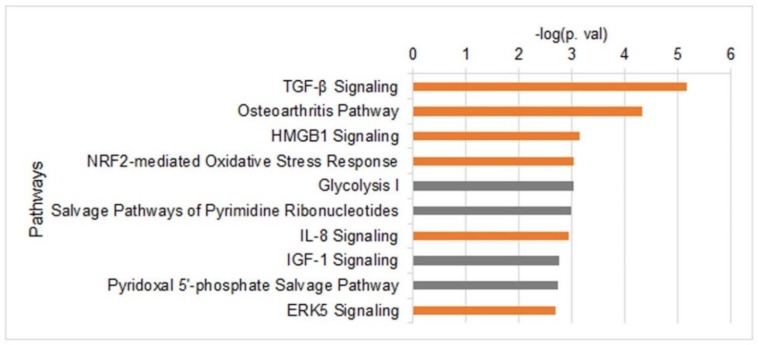
Figure 4.
Altered gene expression upon induction of migration. Top 10 pathways that are altered upon induction of migration as were identified by IPA using RNA-seq data collected from control cells and migrating cells (n = 5). Only genes that were differentially expressed by a factor of >1.3 and FDR <0.05 were included in the analysis. Orange bars represent up-regulated pathways and grey bars represent altered pathways in which the altered genes did not have a uniform trend.

