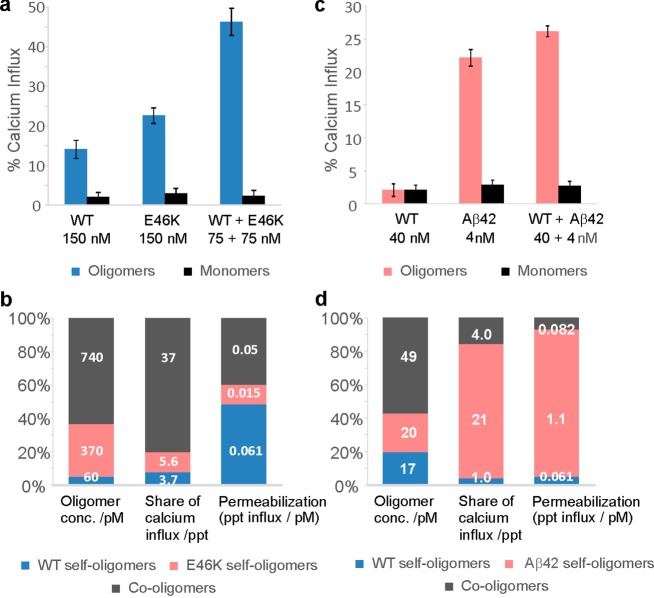
Figure 5.
Quantification of the Ca2+ influx induced by oligomers using the single vesicle assay. (a) Experimentally measured average values of Ca2+ influx, induced by the oligomers formed at equilibrium in solutions containing αS WT and E46K (concentrations in monomer equivalents). Error bars correspond to the standard deviations from three separate experiments for each experimental condition (p = 0.0495). (b) Comparing self- and co-oligomer populations to their contributions to total Ca2+ influx, and their relative permeabilization propensity, in the αS solution containing both 75 nM WT and 75 nM E46K. (c) Average values of Ca2+ influx induced by the oligomers formed at equilibrium in solutions containing αS WT and Aβ42 (concentrations in monomer equivalents). Error bars correspond to the standard deviations from four separate experiments for each experimental condition (p = 0.0209). (d) Comparing self- and co-oligomer populations to their contributions to total Ca2+ influx, and their relative permeabilization propensity, in the solution containing both αS (40 nM WT) and Aβ42 (4 nM).

