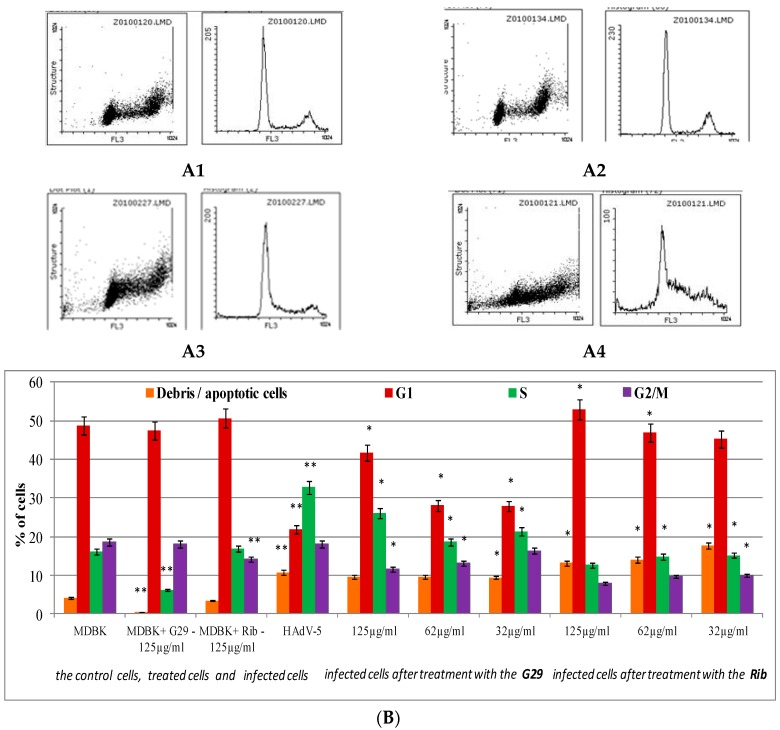
Figure 3.
The influence of the compound G29 on the cell cycle of the MDBK cells in the presence and absence of adenovirus infections. (A1)—Cell cycle profile of the control cells; (A2,A3)—cell cycle profiles of treated cells (the compounds were used in the highest concentration used for the analysis of antiviral activity); (A4)—cell cycle profiles of cells infected with adenovirus. (B) Cell cycle features of infected cells after treatment with the compounds were measured by flow cytometry after staining with propidium iodide. Cell cycle profiles were analyzed with the Flowing Software, version 2.5 (Cell Imaging Core, Turku Centre for Biotechnology, Turku, Finland). Results corresponding to the percentage of cells in G1, S, and G2/M phases of three independent experiments are presented as mean ± S.D. * Significant difference between test sample and control of infected cells (p < 0.05). ** Significant difference between a test sample and control cells (p < 0.05).

