Figure 4.
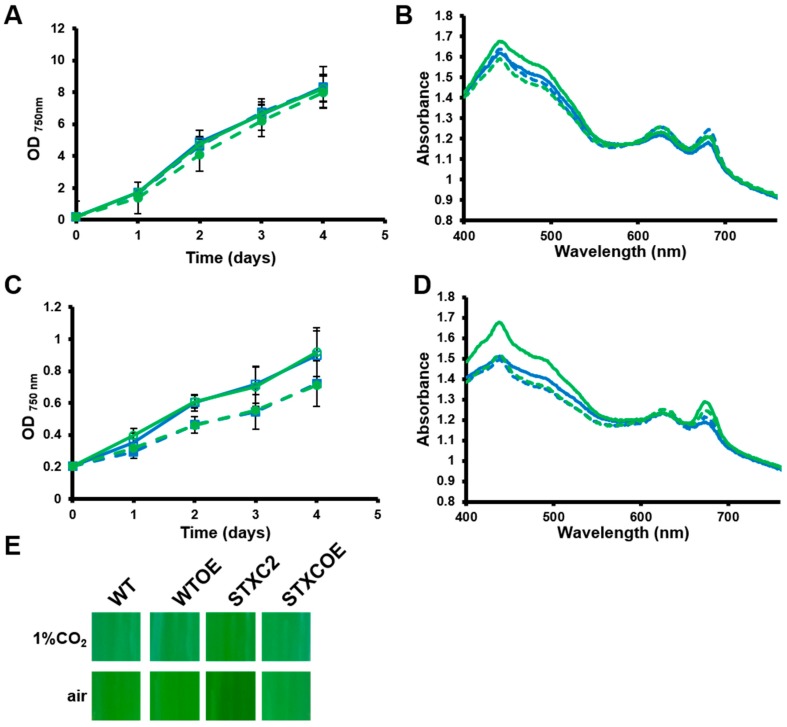
Overexpression of trxC slows growth in low carbon conditions. (A) Growth of trxC mutant strains in high carbon conditions. WT (□), STXC2 (○), WTOE (■) and STXCOE (●) were grown in BG11 pH 7.5 under low light until the exponential phase, diluted to 0.2 OD750nm and shifted to 180 μmol m−2 s−1 light intensity bubbled with air + 1% CO2. Growth was monitored by measuring OD750nm. Data represented are the mean and standard error of 3–4 (depending on the time point) biological independent cultures. (B) Whole cell spectra of WT (blue solid line), STXC2 (green solid line), WTOE (blue dashed line) and STXCOE (green dashed line) grown as in (A). (C) Growth of trxC mutant strains in low carbon conditions. WT (□), STXC2 (○), WTOE (■) and STXCOE (●) were grown in BG11 pH 7.5 under low light until the exponential phase, diluted to 0.2 OD750nm and shifted to 180 μmol m−2 s−1 light intensity and bubbled with air. Growth was monitored by measuring OD750nm. Data represented are the mean and standard error of 3–4 (depending on the time point) biological independent cultures. (D) Whole cell spectra of WT (blue solid line), STXC2 (green solid line), WTOE (blue dashed line) and STXCOE (green dashed line) grown as in (C). (E) Photograph of WT, STXC2, WTOE and STXCOE cultures grown in BG11 pH 7.5 bubbled with air + 1% CO2 or air.

