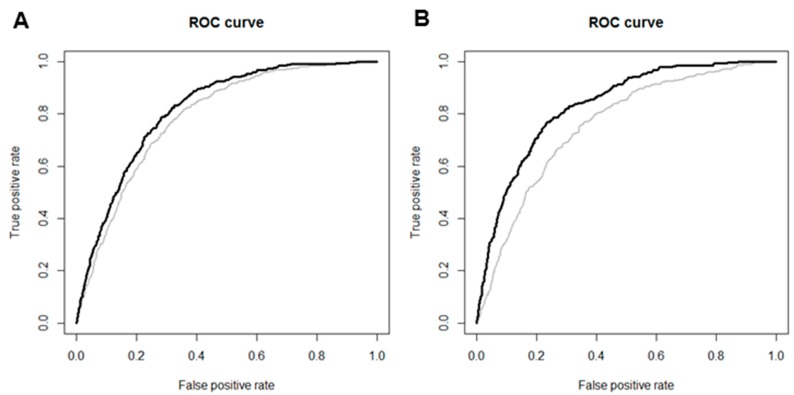
Figure 4.
Receiver operating characteristic (ROC) curves for the development of eGFR <60 mL/min/1.73 m2 in female (A) and male (B) subjects. Areas under the curve (AUCs) were improved to 0.83 from 0.80 in female subjects and to 0.85 from 0.78 in male subjects when sCr levels were added to traditional risk factors for CKD. Gray lines represent ROC curves with traditional risk factors including age, BMI, SBP, history of HTN, DM, CVDs, hemoglobin, fasting plasma glucose, albumin, and total cholesterol. Black lines represent ROC curves with sCr levels added to traditional risk factors.

