
Figure 2.
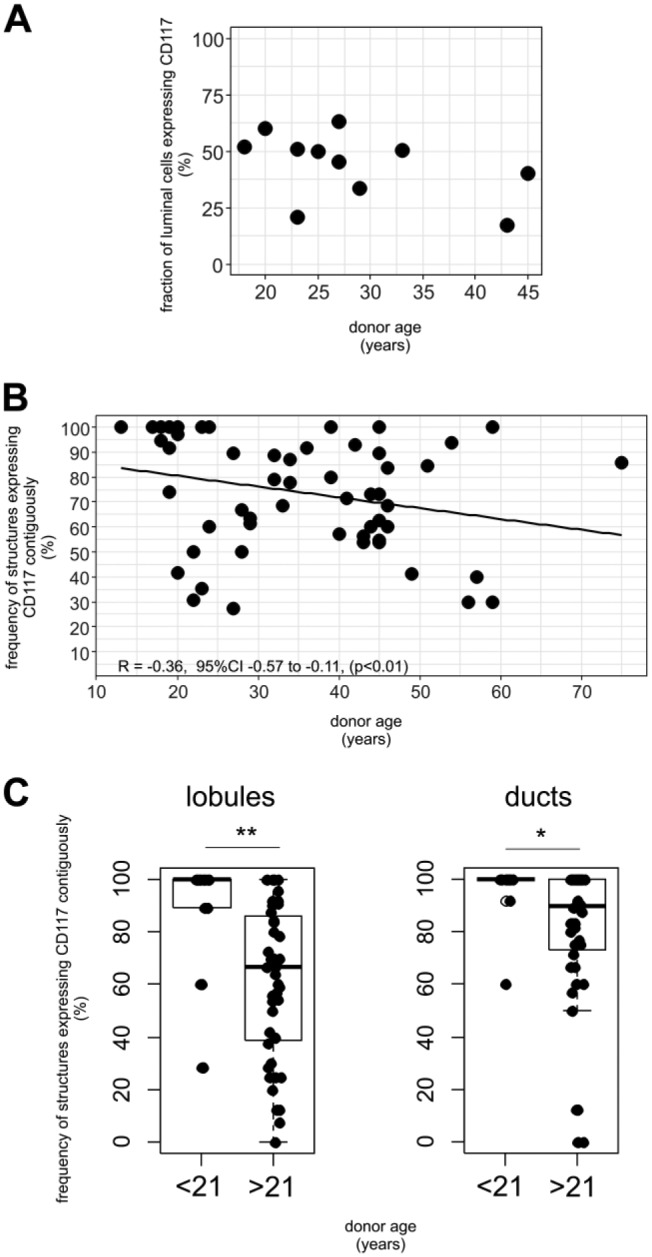
The pattern of CD117-expression varies with age. (A) Scatter plot showing the frequency of CD117-positive cells in 11 individuals by flow cytometry. (B) Scatter plot showing the percentage of contiguous structures of all evaluated structures according to age. Spearman correlation test revealing a significant reduction of contiguous structures with increased age (ρ = −0.36, p<0.01). (C) Box plots showing the distribution of glandular structures with a contiguous pattern of CD117-expression in lobules and ducts, respectively, divided into two age groups: <21 and >21 years of age.*p<0.05, **p<0.0005.