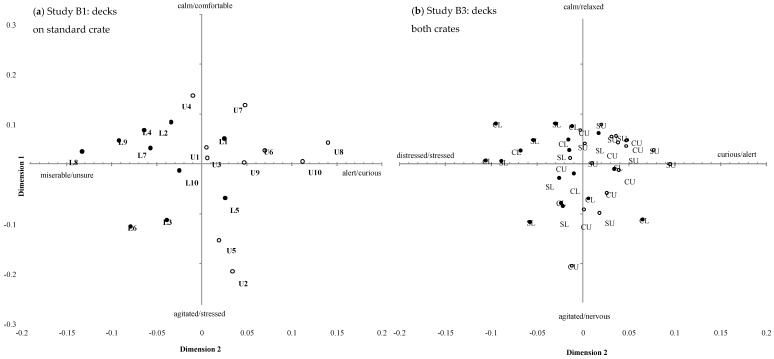
Figure 6.
Positions of individual transport clips on GPA dimensions 1 and 2 obtained for (a) Study B1 standard crate experiment (Numbers represent each transport trip, U: upper deck, open circles, or L: lower deck, closed circles) and (b) Study B3 crate design experiment (SU: standard crate upper deck, open circles, SL: standard crate lower deck, closed circles, CU: convertible crate upper deck, open circles and CL: convertible crate lower deck, closed circles). Bold text indicates GPA dimensions 2 for both studies were statistically significantly different between treatments.

