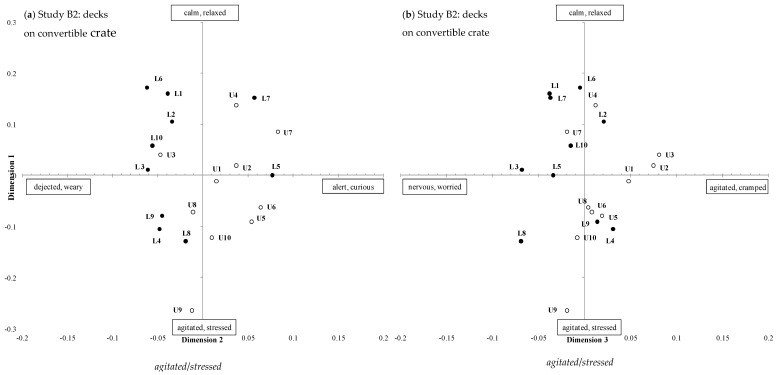
Figure 7.
Positions of individual transport clips (numbers represent each transport trip) obtained from Qualitative Behavioural Assessment in Study B2 for convertible crate experiment (U: upper deck, open circles, or L: lower deck, closed circles) showing the same data plotted for (a) GPA dimensions 1 and 2 and (b) GPA dimensions 1 and 3.

