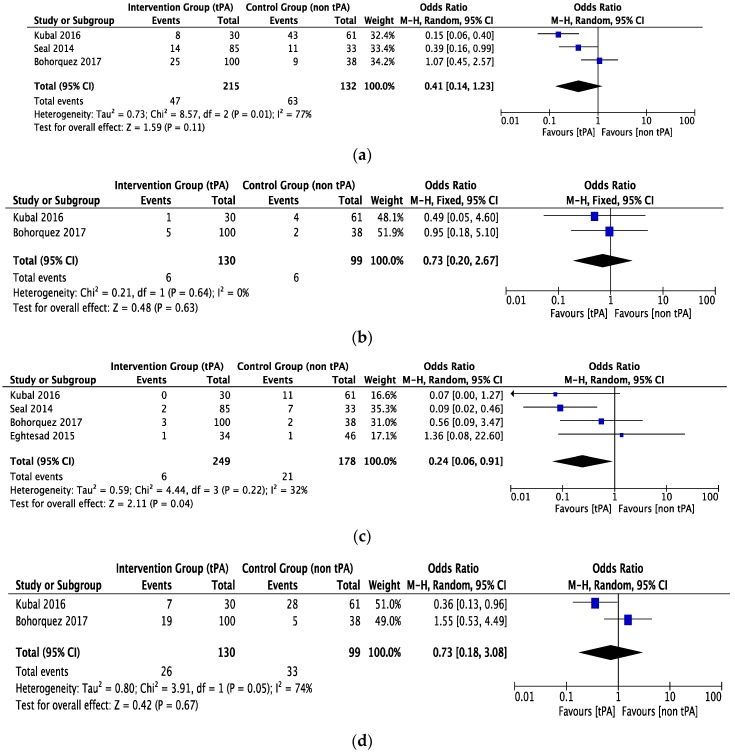
Figure 4.
The forest plot represents, (a) the total biliary complication in DCD liver recipients with or without prior thrombolytic (tPA) flush. The size of the squares depicts the effects while comparing the weight of the study in the meta-analysis. The diamond doesn’t suggest any significant difference following random effects analysis. A 95% confidence interval is represented by horizontal bars. (b) The bile leak in DCD liver recipients with or without prior thrombolytic (tPA) flush. The size of the squares depicts the effects while comparing the weight of the study in the meta-analysis. The diamond doesn’t suggest any significant difference following fixed effects analysis. A 95% confidence interval is represented by horizontal bars. (c) The ischemic-type biliary lesions (ITBLs) in DCD liver recipients with or without prior thrombolytic (tPA) flush. The size of the squares depicts the effects while comparing the weight of the study in the meta-analysis. The diamond shows the significant favor towards the tPA flush group following random effects analysis. A 95% confidence interval is represented by horizontal bars. (d) The anastomotic biliary stricture in DCD liver recipients with or without prior thrombolytic (tPA) flush. The size of squares depicts the effects while comparing the weight of the study in the meta-analysis. The summary effect (diamond) doesn’t suggest any significant difference following fixed effects analysis. A 95% confidence interval is represented by horizontal bars; DCD, donor after circulatory death; tPA, tissue plasminogen activator; ITBLs, ischemic-type biliary lesions.

