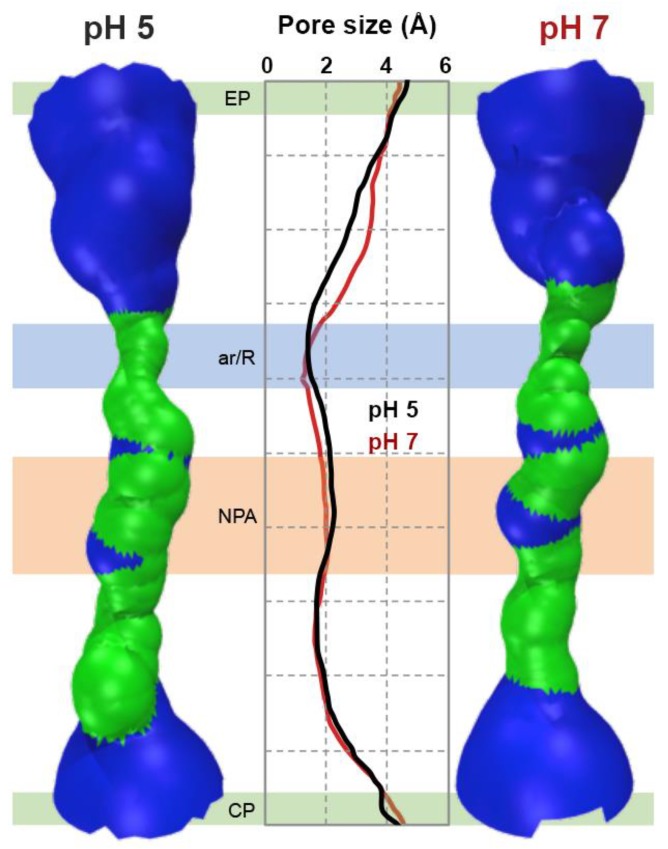
Figure 3.
Pore size of hAQP7 monomer A at pH 5.0 and pH 7.0. Surface of a representative snapshot of monomer A (based on van der Waals radii): Red = smaller than single H2O, green = single H2O, blue = larger than single H2O. Pore size represented as an average of all monomers in five simulations at each pH value (pH 5.0 in black and pH 7.0 in red traces). EP–extracellular pocket, ar/R–aromatic/arginine selectivity filter, NPA–NPA motif, CP–cytoplasmic pocket. Figure generated by HOLE [53] and VMD [63].

