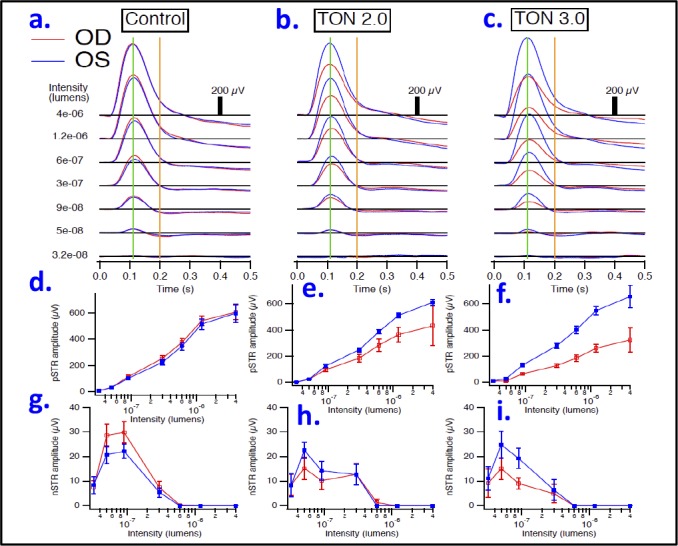
Figure 4.

Representative scotopic threshold responses. Averaged responses are shown for control naïve mice (a), traumatic group injured with impactor velocity 2.0 m/s (b), and traumatic group injured with impactor velocity 3.0 m/s (c). Intensities are listed on the left, in lumens. Blue traces are responses obtained from the left eyes, whereas red traces are responses obtained from the right eyes. At 110 ms after the stimulus onset (green vertical lines), pSTRs were measured for each intensity relative to baseline (horizontal black lines) and plotted in (d–f) for each aforementioned group. At 200 ms after the stimulus onset (orange vertical lines) nSTRs were measured at eachintensity, and plotted in (g–i) for each aforementioned group. n = 3–4/group; OD, right eye; OS, left eye.
