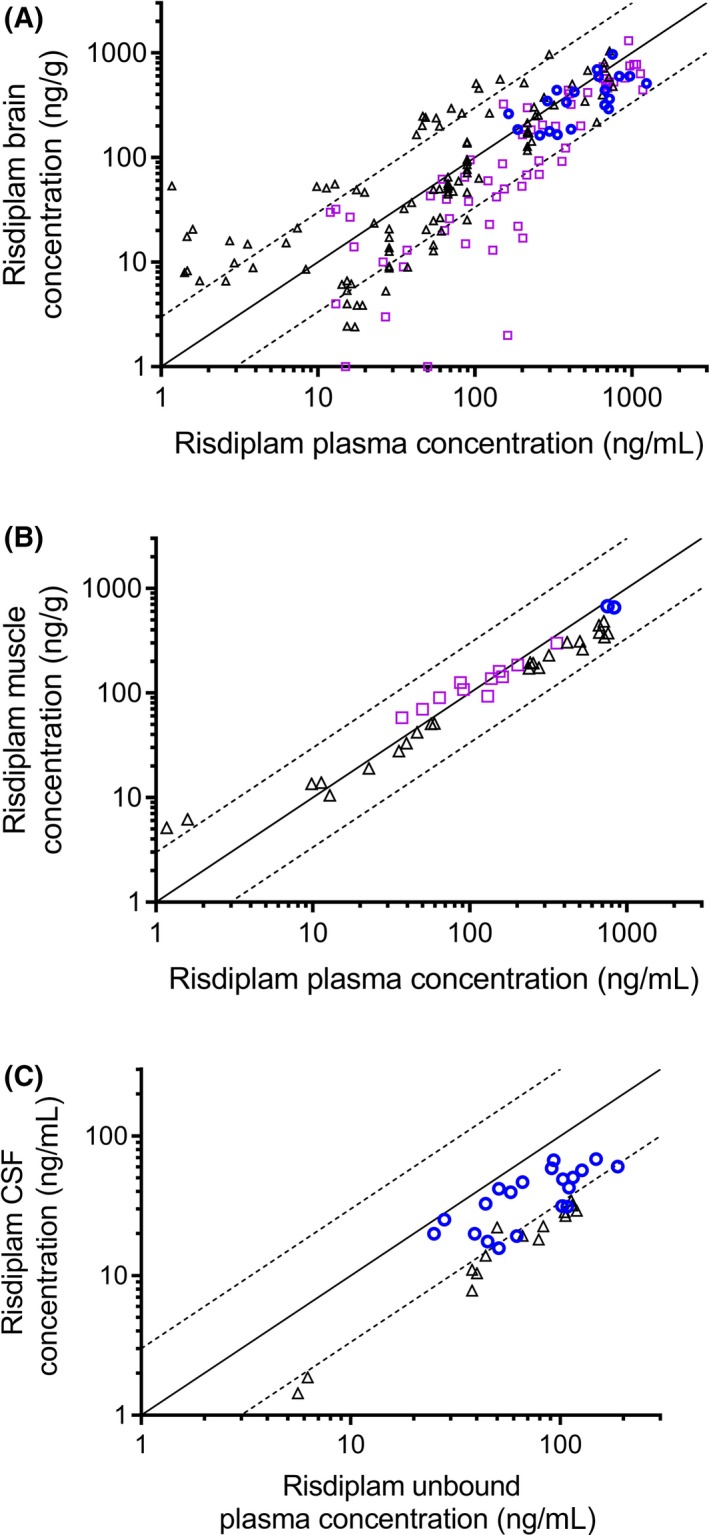
Figure 1.

Risdiplam tissues concentration vs risdiplam plasma concentration: A, brain (n = 189) (Studies 1‐4, 6‐10). B, muscle (n = 37) (Studies 4,7,9), and C, CSF (n = 35) (Studies 7,9,10) of mice (open squares), rats (open triangles), and monkeys (open circles) following single or repeat PO or IP administration. Each symbol represents data coming from an individual animal. The solid line represents the line of unity. The dotted lines represent threefold variation around unity. CSF, cerebrospinal fluid; IP, intraperitoneal; PO, per os
