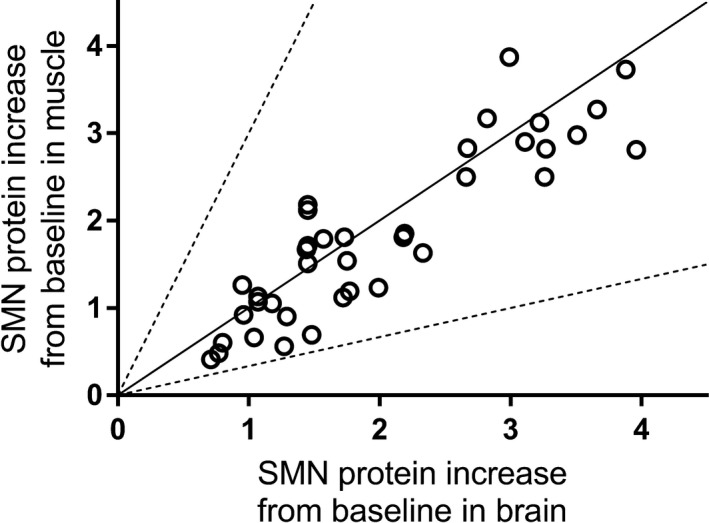
Figure 7.

SMN protein increase in muscle vs brain in SMA mice following administration of risdiplam. SMN protein increase from baseline (reported as ratio of SMN protein levels in treated vs control) in muscle vs brain of adult C/C‐allele SMA mice (Study 3, n = 4 per dose) dosed 1, 3, or 10 mg/kg/day PO for 10 days, and postnatal day 10 SMNΔ7 mice (Study 4, n = 6 or 7 per dose) dosed 0.1, 0.3, 1, or 3 mg/kg/day PO for 7 days. The solid line represents the line of unity. Each symbol represents data coming from an individual animal. PO, per os; SMA, spinal muscular atrophy; SMN, survival motor neuron; SMNΔ7, truncated SMN protein
