Figure 2.

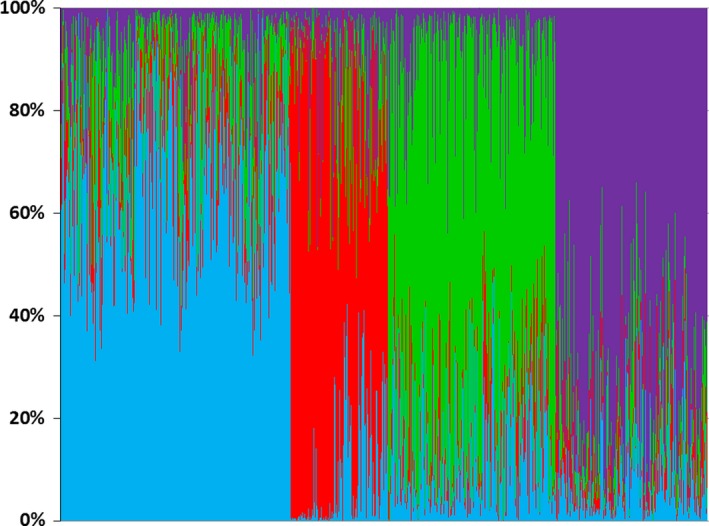
Bayesian clustering analysis showing barplots for the proportion of cluster memberships assigned to individual wolves under the estimated optimal numbers of clusters (K max = 4). Different colors indicate different clusters

Bayesian clustering analysis showing barplots for the proportion of cluster memberships assigned to individual wolves under the estimated optimal numbers of clusters (K max = 4). Different colors indicate different clusters