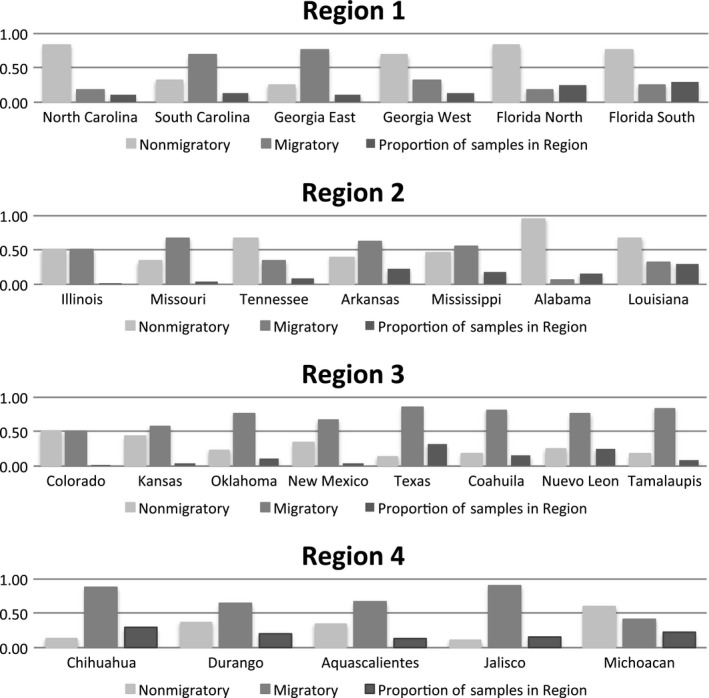
Figure 2.

Proportion of individual Loggerhead Shrike assigned as migratory and nonmigratory within each sample area based on genetic admixture coefficient Q ≥ 0.80 (Eastern United States, Region 1, n = 63; Central United States, Region 2, n = 54; Western United States and Eastern Mexico, Region 3, n = 209, Western Mexico, Region 4, n = 130)
