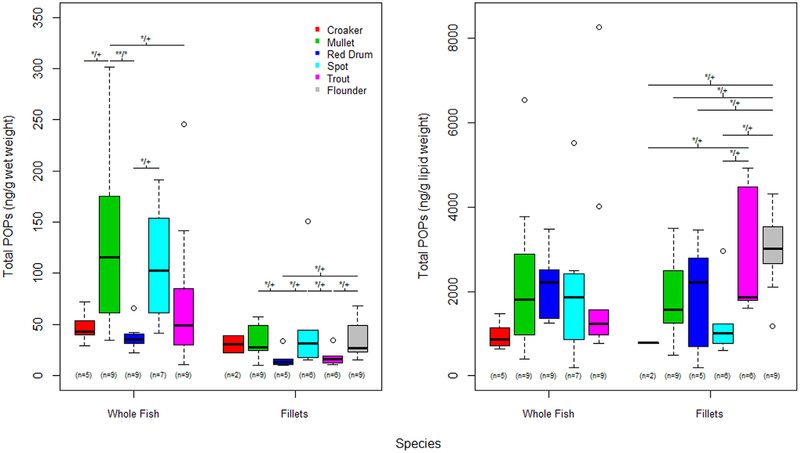
Fig. 3.
Distribution of Total POPs in ng/g wet weight and ng/g lipid weight by species and sample type (whole fish vs. fillet). Boxes represent the 25th 50th and 75th percentiles for the observed distribution, the whiskers represent 1.5 × inner-quartile range (IQR), and points outside the whiskers represent any observed value that is less than or greater than 1.5 × IQR. The number of samples per group are shown below each box. Note, lines above the boxes indicate significant relationships; with **/** above the line represent the observed range for the unadjusted p-value/Tukey HSD adjusted p-value where ** is p < 0.01, * is p < 0.05, + is p not significant (only used for adjusted p-values).

