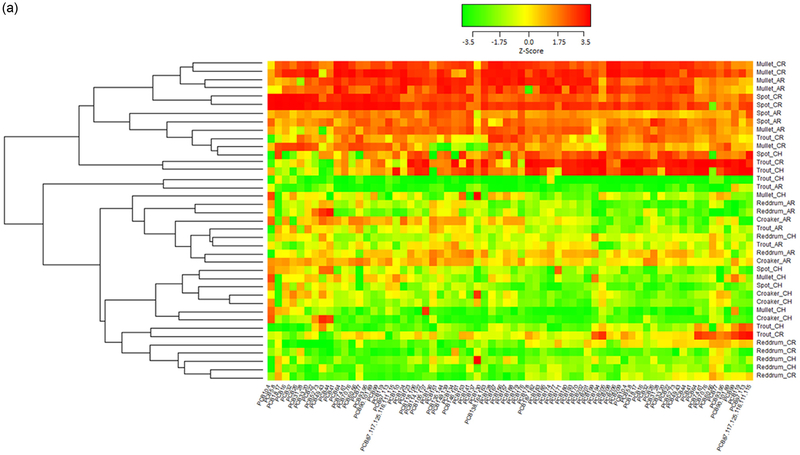
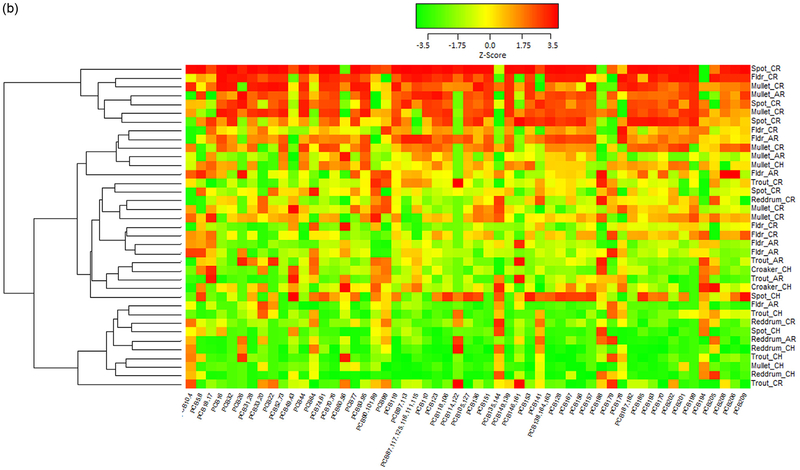
Fig. 4.
A. Heat map of PCBs wet weight ng/g in whole fish by fish species (Atlantic croaker, red drum, spot, spotted sea trout, striped mullet) and location (CH=Charleston Harbor, CR=Cooper River, AR=Ashley River). All PCB values were normalized to ensure all PCBs were on the same scale. Red indicates levels higher than the average across all fish, yellow indicates levels near the mean, and green indicates levels that are lower than average. The dendogram on the left side of the heat map show the clusters found using complete linkage clustering and Euclidean distance between points as the distance metric. Note, only contaminants with detectable levels in at least 75% of samples were considered for clustering. B. Heat map of PCBs wet weight ng/g in fillets by fish species (Atlantic croaker, red drum, spot, spotted sea trout, striped mullet, flounder) and location (CH=Charleston Harbor, CR=Cooper River, AR=Ashley River). All PCB values were normalized to ensure all PCBs were on the same scale. Red indicates levels higher than the average across all fish, yellow indicates levels near the mean, and green indicates levels that are lower than average. The dendogram on the left side of the heat map show the clusters found using complete linkage clustering and Euclidean distance between points as the distance metric. Note, only contaminants with detectable levels in at least 75% of samples were considered for clustering.


