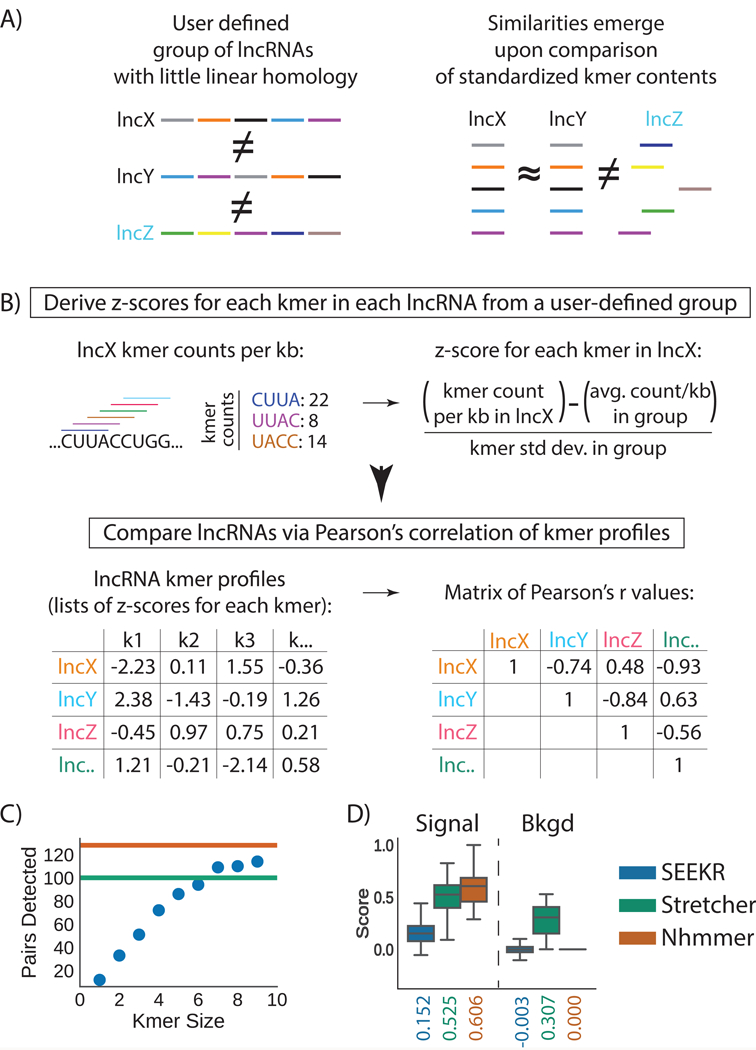
Figure 1. Overview and initial test of kmer-based sequence comparison.

(A) LncRNAs of related function (names in black) may harbor similar sequence similarity in the form of motif content (colored bars) even if they lack linear homology. (B) In SEEKR, the abundance of all kmers of length k are counted by tiling across each lncRNA in a user-defined group in one nucleotide increments. Kmer counts are normalized for lncRNA length, and standardized across the group to derive z-scores. Similarity is evaluated by comparing lncRNA kmer profiles (lists of z-scores for each kmer in the lncRNAs) with Pearson’s correlation. (C) Number of homologous pairs detected by SEEKR vs. kmer length in a test set of conserved lncRNAs. Green and orange lines mark the homologue number detected by Stretcher and nhmmer, respectively. (D) Signal to background ratios for homologue detection via the three methods. Tukey boxplots show the lower, median, and upper quartile of values, and ±1.5x the IQR (n=161 r values for signal, n=12880 r values for background); outliers are not shown.
