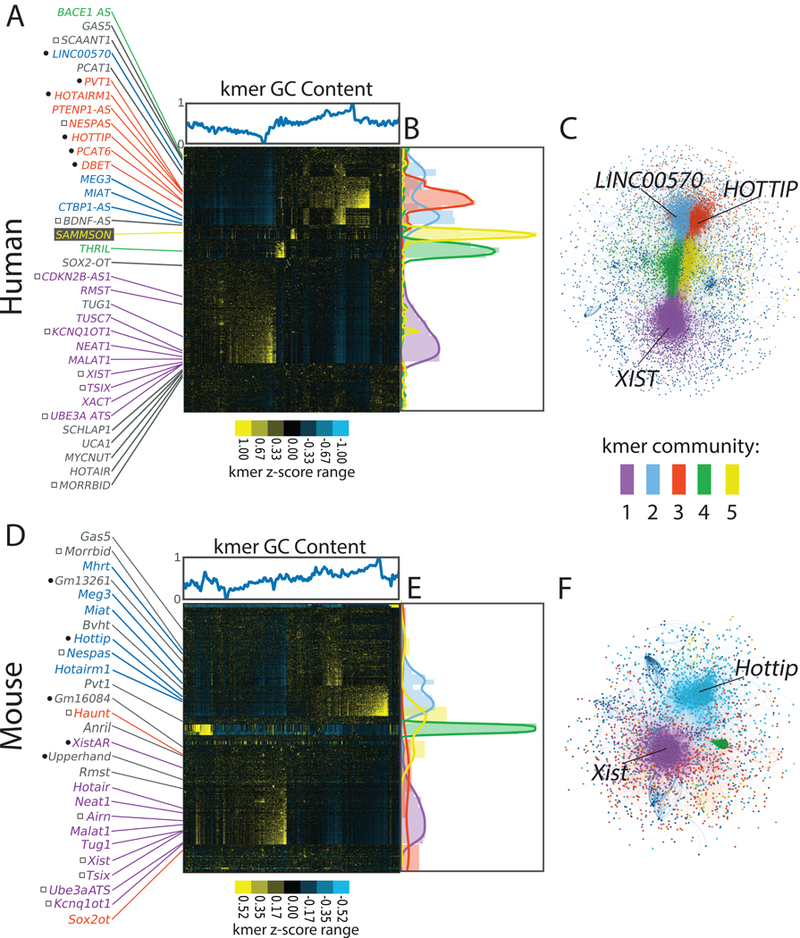
Figure 2. LncRNAs of related function often have related kmer contents.

(A) Hierarchical cluster of all human GENCODE lncRNAs at kmer length 6, with lncRNAs and kmers on the x- and y-axes, respectively. Kmer z-scores (relative kmer abundance) range from blue (lowest) to yellow (highest). GC content of kmers is shown above the x-axis. Locations of select lncRNAs are marked. Left of lncRNA names, black circles indicate cis activators and squares indicate cis repressors. (B) Locations of lncRNAs assigned to communities 1 through 5 via the Louvain/network-based approach. (C)Network graph of Louvain-assigned lncRNA communities. LncRNA names in (A) are colored by their Louvain community assignment; lncRNAs in gray were assigned to the null. (C, D, E) Same as (A, B, C) but for mouse GENCODE lncRNAs.
