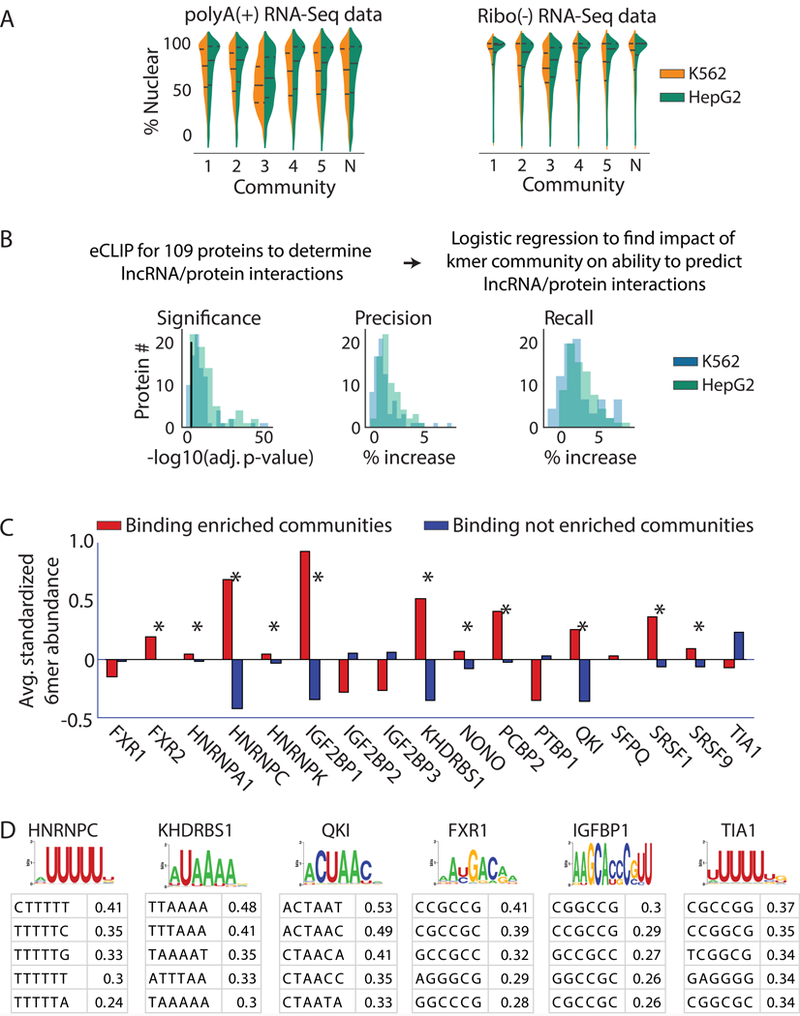
Figure 3. LncRNA localization and protein binding correlate with kmer content.

(A) Violin plots of lncRNA localization by kmer community in K562 (blue) and HepG2 (green) cells, as determined from RNA-Seq of polyA-selected and ribosome-depleted RNA. “N”, the “null” community. Lines show the lower, median, and upper quartile of values (see Supplemental Figs. 13–16 for samples sizes). (B) From left to right; Log10 significance of increase in likelihood (i), % increase in precision (ii), and % increase in recall (iii) obtained when lncRNA community information is included in a logistic regression to predict protein association. Black line in (i) corresponds to a log10(adjusted p-value) of 0.05 (n=3747 lncRNAs for HepG2, n=3278 lncRNAs for K562). (C) 11 of the 17 proteins with experimentally determined PWMs from 23 show significantly increased abundance of motif-matching kmers (n=4096) in lncRNA communities that are enriched for binding to the protein in question (p<0.01; permutation test; marked by *’s). (D) The most enriched kmers in 300 nucleotide windows surrounding motif matches in CLIP peaks do not always match the motif. PWMs from 23 are shown above average z-scores for the top 5 most enriched kmers in true positive relative to false positive binding regions for the protein in question. PWMs and top kmers are shown for all 17 proteins in Supplementary Fig. 5.
