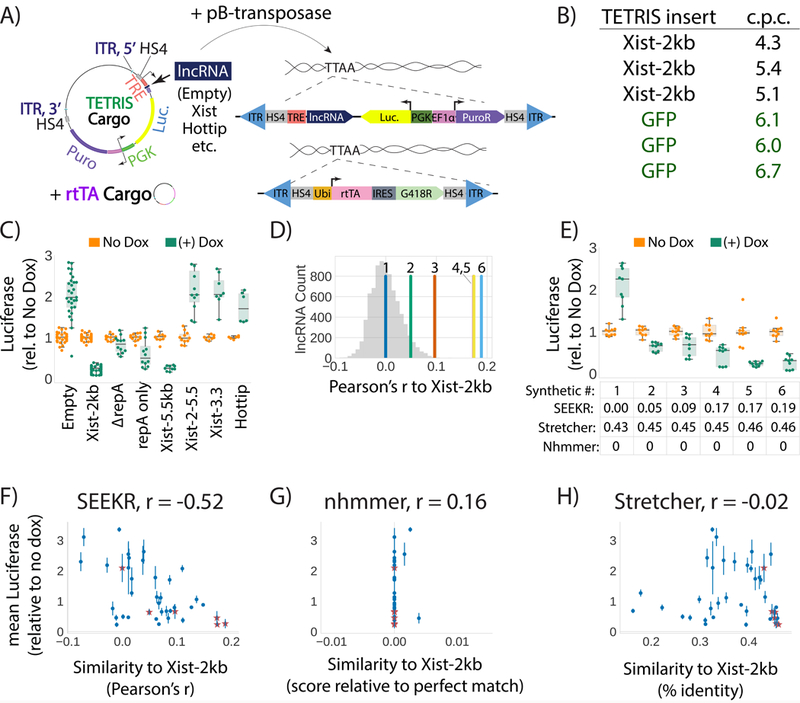
Figure 4. Kmer content correlates with lncRNA repressive activity.

(A) Overview of vectors and concept of the TETRIS assay. (B) Number of TETRIS-lncRNA-cargo insertions per cell (“c.p.c.”) after 10-day drug selection for two separate cargos, Xist-2kb and GFP. Each row represents copy number data from independent replicates. (C) Luciferase values for different TETRIS-lncRNA constructs relative to No Dox. Tukey boxplots as in Fig. 1D. Data are from at least six independent luciferase assays from at least two biological replicate derivations of TETRIS cell lines. Exact numbers of assays and replicates performed for each TETRIS lncRNA cargo are found in Supplementary Table 22. (D) Pearson’s r similarity of kmer profiles for the six synthetic lncRNAs relative to the first 2kb of Xist. Histogram of similarity of Xist-2kb to all other GENCODE M5 lncRNAs is shown in gray. (E) Effect of synthetic lncRNA expression on luciferase activity. Tukey boxplots as in Fig. 1D. SEEKR, Stretcher, and nhmmer similarity for each synthetic lncRNA relative to the first 2kb of Xist is shown below the graph. (F, G, H) Pearson’s correlation between repressive activity and similarities to Xist-2kb as defined by SEEKR, nhmmer, and Stretcher for thirty-three endogenous lncRNAs/lncRNA fragments (dots) and six synthetic lncRNAs (stars) (mean ± standard deviation). See Supplementary Table 22 for sample sizes in panels C, E, F, G, H.
