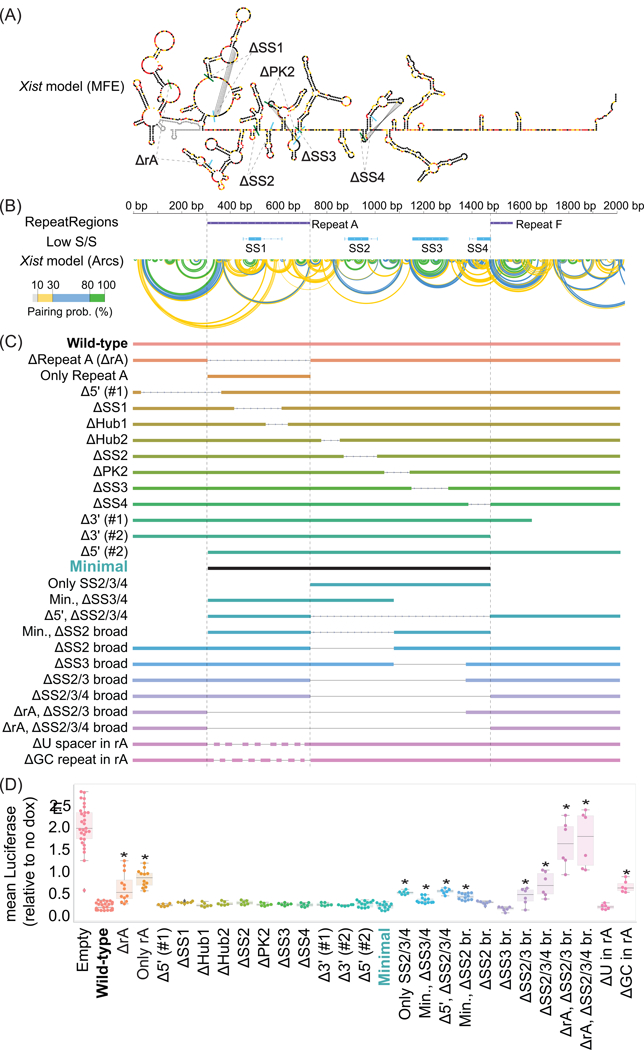
Figure 5. Mapping of elements required for repression by Xist-2kb in TETRIS.

(A) Minimum Free Energy (MFE) and (B) arc-based structural models of the first 2kb of Xist from 41; green and blue bars in (i) mark starts and stops of indicated regions; locations of Xist repeats 7 and predicted stable structures (low S/S, regions of low SHAPE reactivity and Shannon entropy from 41) are also shown in (ii). (C) Deleted regions. (D) Effects on luciferase after dox addition. *, Bonferroni corrected p<0.001 relative to Wild-type/Xist-2kb via Student’s t-test. Tukey boxplots show the lower, median, and upper quartile of values, and ±1.5x the IQR (see Supplementary Table 22 for sample sizes and exact p-values).
