Fig. 6.
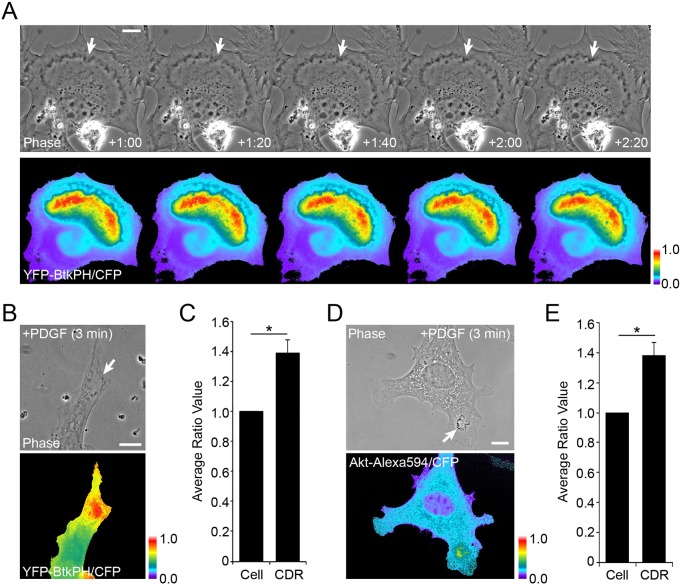
Akt signaling at PDGF-induced CDRs. (A) Live-cell imaging of MEFs expressing YFP–Btk-PH and CFP after stimulation by PDGF (2 nM). Time after addition of growth factor is indicated at bottom of phase contrast images (minutes:seconds). Comparison of phase contrast and ratio (YFP–BtkPH/CFP) images shows sustained high ratio values inside CDRs (arrows). (B) MEFs expressing YFP–Btk-PH and CFP were fixed after 3 min stimulation with PDGF (2 nM). High ratio values were observed inside CDRs (arrow). (C) Quantitation of images in B. In 9 MEFs with CDRs, the intensities of the ratio over the cell (Cell) and CDR area (CDR) were measured and compared. (D) Fluorescence microscopy of Akt recruitment to CDRs in MEFs. MEFs expressing CFP were stimulated with PDGF (2 nM) for 3 min and fixed for immunofluorescence staining for Akt (Alexa Fluor 594-tagged secondary antibody). Comparison of phase contrast and ratio images (Akt–Alexa Fluor 594/CFP) shows higher ratio values in CDRs (arrow). (E) Quantitation of images in D. In 9 MEFs with CDRs, the intensities of the ratio over the cell and CDR area were measured then compared. Student's t-test was applied for the statistics; *P<0.05. All color bars indicate relative values of ratio intensities. Scale bars: 10 µm.

