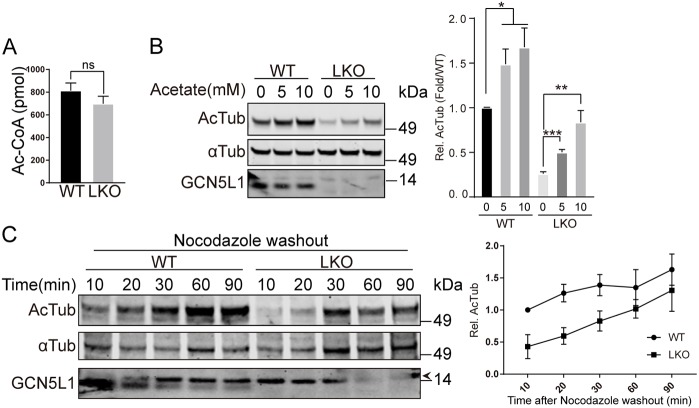
Fig. 2.
GCN5L1 modulation of α-tubulin acetylation is independent of cellular acetyl-CoA levels. (A) The whole-cell levels of acetyl-CoA (Ac-CoA) were similar in GCN5L1 LKO and WT hepatocytes. Ac-CoA content was quantified by HPLC as described in the Materials and Methods. (B,C) The supplementation of media with acetate (B) increased acetylated α-tubulin (Ac-Tub) levels in WT and LKO hepatocytes and levels of acetylation of α-tubulin (αTub) were assessed using immunoblot analysis and quantification. α-Tubulin was used as a loading control. (C) Ac-Tub recovery kinetics in response to nocodazole was similar in WT and LKO hepatocytes. αTub acetylation was assessed after an initial exposure to nocodazole for 5 h and then, following washout, repolymerization is associated with reacetylation of α-tubulin. The extent of acetylation was assessed over a 90 min period by following the level of the acetylation of α-tubulin by immunoblot analysis. The accompanying line chart represents the relative quantified ratio of Ac-Tub to αTub normalized to the initial WT samples. Results are mean±s.e.m. of three independent experiments. α-Tubulin was used as loading control. Representative images are shown from three independent experiments. *P<0.05; **P<0.01; ***P<0.001; ns, not significant (unpaired Student's t-test).

