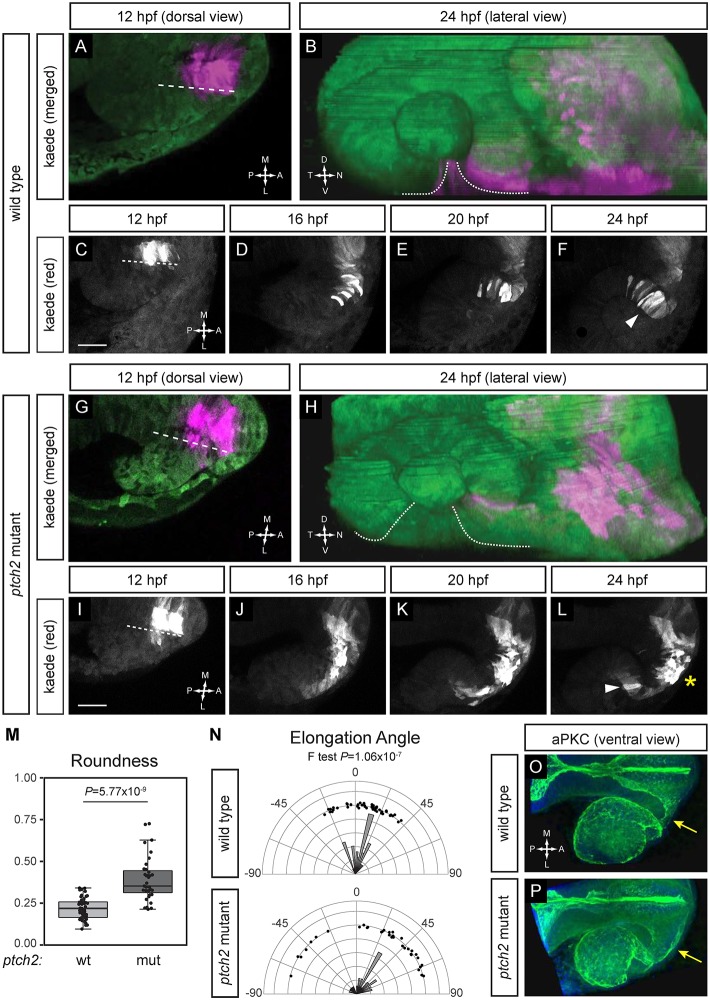
Fig. 4.
Migratory behaviors of cells contributing to optic fissure formation are disrupted in the ptch2tc294z mutant. (A-F) Wild-type cell movements, cells marked with cytoplasmic Kaede. (A) Merged image of marked cells, 12 hpf, dorsal view. (B) Merged rendering of marked cells, 24 hpf, lateral view. (C-F) Projections from four-dimensional imaging data set of marked cells moving to the ventronasal retina and optic fissure nasal margin. (G-L) Cell movements in the ptch2tc294z mutant. (G) Merged image of marked cells, 12 hpf, dorsal view. (H) Merged rendering of marked cells, 24 hpf, lateral view. (I-L) Projections from four-dimensional imaging data set of marked cells: most cells (asterisk) remain in the optic stalk. (M) Comparison of roundness in wild-type (wt) and ptch2tc294z mutant (mut) embryos (unpaired Welch's t-test to account for unequal variance). n=49 cells from 18 embryos for wt; 35 cells from 11 embryos for mut. (N) Comparison of elongation angle in wild-type (wt) and ptch2tc294z mutant (mut) embryos (F-test to determine the probability that the variances are not significantly different). n=49 cells from 18 embryos for wt; 35 cells from 11 embryos for mut. (O,P) aPKC antibody staining in wild-type (O) and ptch2tc294z mutant (P) embryos, 24 hpf, ventral view. No gross defects in apicobasal polarity in ptch2tc294z mutants are apparent. Yellow arrows indicate the optic stalk. Dashed lines indicate the boundary between optic vesicle and midline region. Dotted lines indicate optic fissure margins. Arrowheads indicate bipolar cells; asterisk indicates cells with an aberrant morphology. Scale bars: 50 µm.

