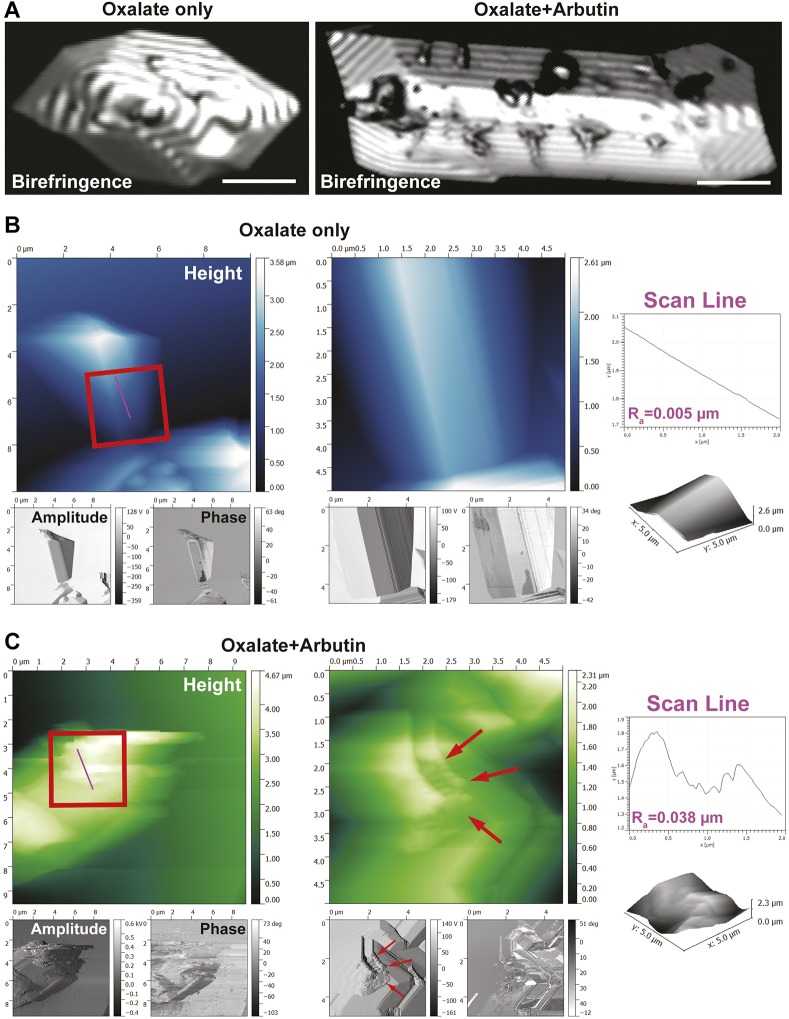
Fig. 6.
Calcium oxalate and arbutin crystal structure interaction analysis. (A) Confocal birefringence images of pure oxalate crystals prior to arbutin exposure (left), and following exposure to arbutin (right). Scale bars: 10 µm. (B) Atomic force microscopy (AFM) image of pure oxalate crystals. Insets in the middle panel provide higher magnification views of the crystal surface. Scan line analysis of the height channel within the inset reveals a smooth topography. (C) Oxalate crystals exposed to arbutin reveal a highly active surface topography decorated with arbutin drug molecules (red arrows). Insets in the left panel reveal a rough surface topography, as shown by scan line analysis of the height channel.

