
Figure 2.
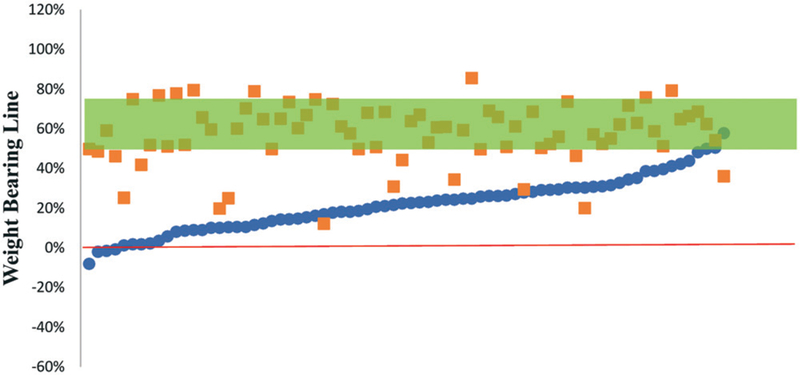
Pre- and post-operative weight-bearing line for the navigated group. Circles are pre-operative values and squares postoperative values. The bar represents the target for correction (50–75%).
Official websites use .gov
A
.gov website belongs to an official
government organization in the United States.
Secure .gov websites use HTTPS
A lock (
) or https:// means you've safely
connected to the .gov website. Share sensitive
information only on official, secure websites.
Pre- and post-operative weight-bearing line for the navigated group. Circles are pre-operative values and squares postoperative values. The bar represents the target for correction (50–75%).