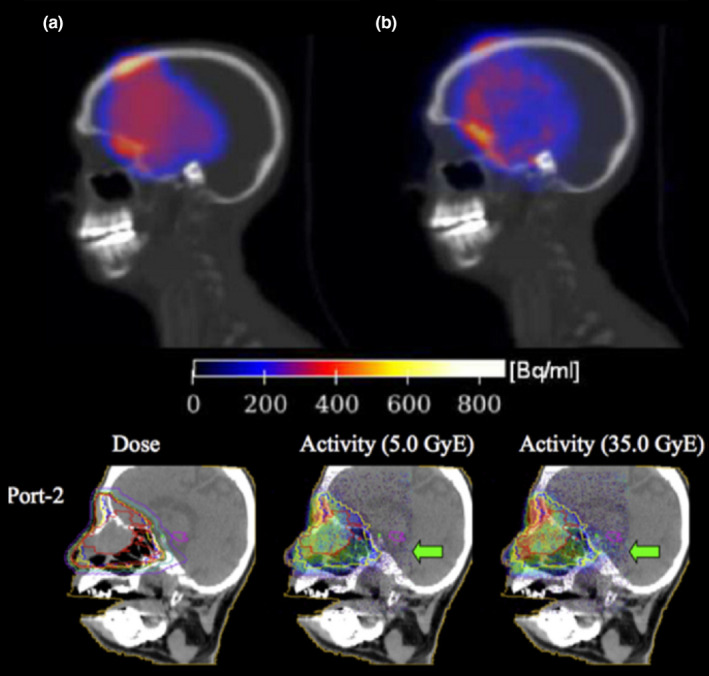
Figure 4.

Example of PET monitoring of passively scattered proton therapy with fraction doses of 1.8–2.5 GyE (RBE 1.1) and imaging starting 140 s (top) and immediately after (bottom) irradiation for a scan time of 1200 s and 200 s, respectively (with permission). Top panel: comparison between simulated (a) and measured (b) activity63 using the in‐room PET scanner shown in Fig. 3(b).49 Bottom panel: comparison between the planned dose distribution for the considered second port (left) and the activity measured with the on‐board planar detector of Fig. 3(a) at two different treatment fractions, corresponding to the total delivery of a biologically weighted dose of 5 GyE (middle) and 35 GyE (right). The arrow marks regions of disagreement, indicating a later radiologically confirmed anatomical change.48
