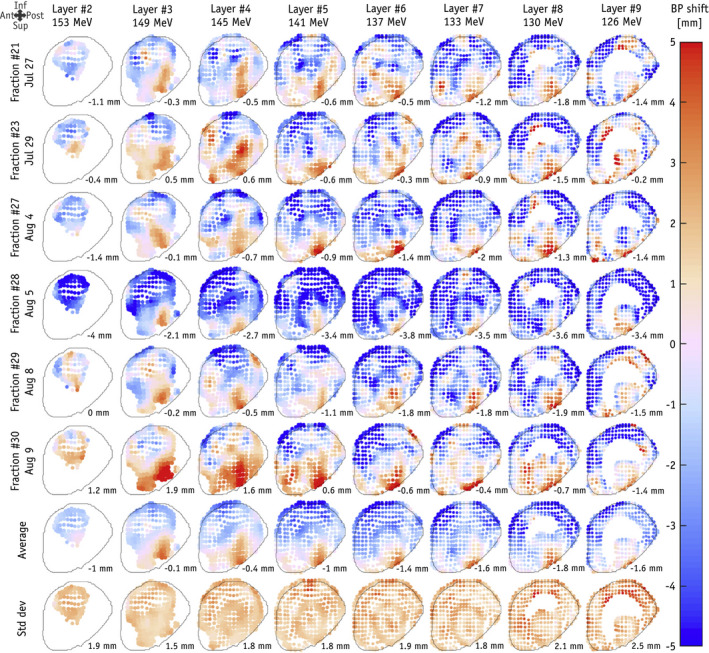
Figure 6.

Range shift maps for individual beam spots for a single treatment field delivered for six different fractions measured with a clinical slit camera. Each map shows the deviation of the measured range from the planned range for each spot in each energy layer of the treatment field (from Xie et al.86 with permission).
