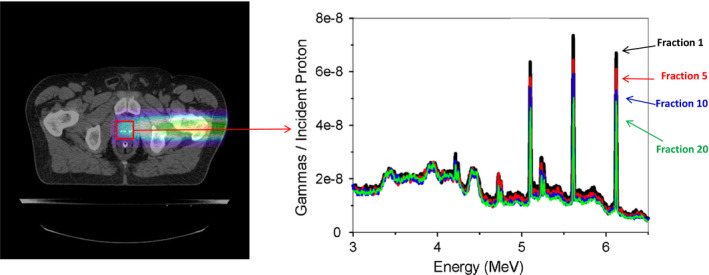
Figure 9.

Illustration of spectroscopic PG imaging in proton or heavy ion therapy. The image is reconstructed from PGs emitted during the delivery of a daily treatment fraction. The PG spectra formed within a specific region of interest (ROI) can then be constructed. Comparison of changes in the relative intensity of PG emission lines from specific elements (6.12 MeV emission from16O highlighted) in the ROI spectra over the course of treatment could potentially be used to infer how the concentration of different elements are changing in response to the treatment (adapted from Polf et al.138 with permission).
