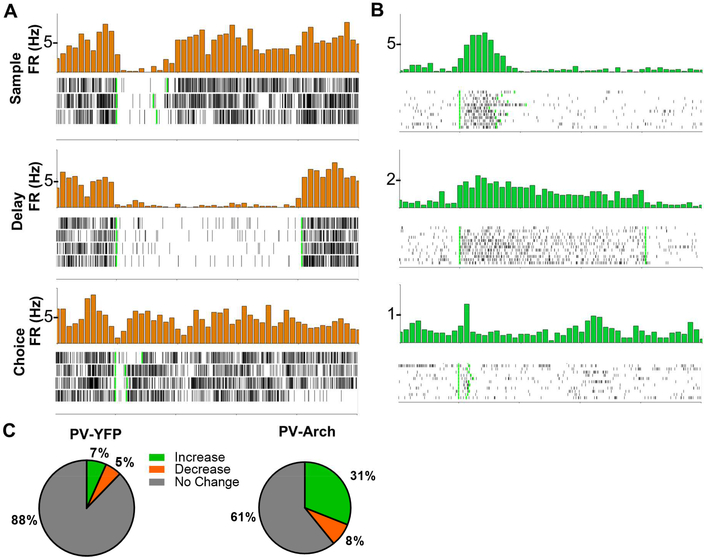
Figure 2: Archaerhodopsin Inhibition of PV Interneurons Decreases Interneuron Firing and Increases Pyramidal Cell Firing.
A.) Time triggered average (green light turns on at time = 0, marked by first vertical green line; green light turns off at second vertical green line) and raster plot of a cell inhibited by Archaerhodopsin during the sample, delay, and choice phases. B.) Time triggered average and raster plot of a cell disinhibited during PV interneuron inhibition during the sample, delay, and choice phases. C.) Proportions of cells with a significant increase or decrease in firing rate in response to sample phase green light as determined by bootstrapping in PV-YFP (N = 179 cells) or PV-Arch (N = 244 cells) animals.

