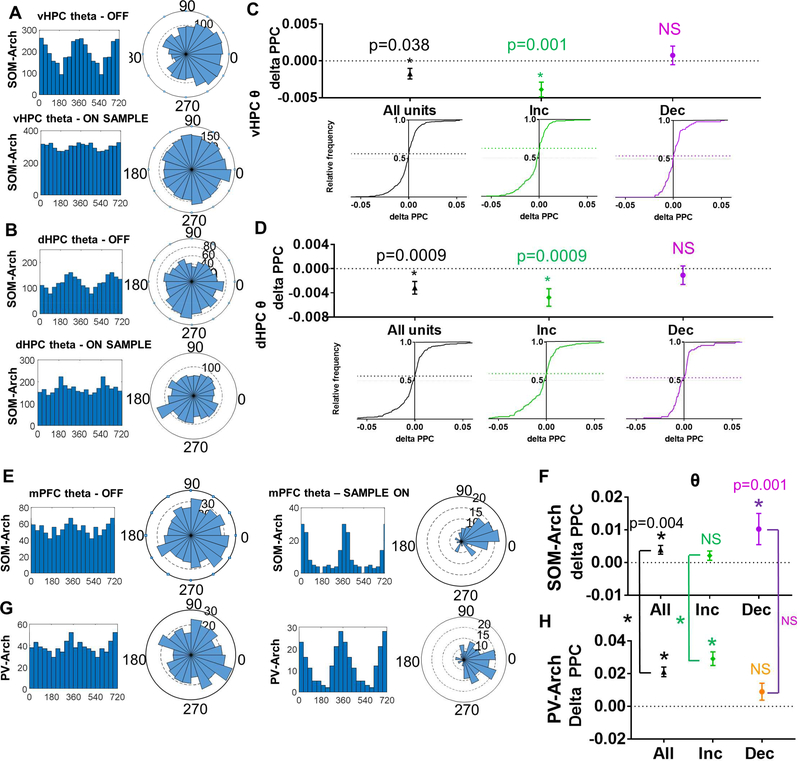
Figure 5: Inhibiting SOM Interneurons During the Sample Phase Leads to Decreased Phase Locking of mPFC Units to vHPC and dHPC Theta and Decreased Phase Locking to Local mPFC Theta.
A.) Histogram and rose plots illustrating a decrease in phase locking of mPFC single units to vHPC theta oscillations during SOM-inhibited trials (see bottom row) as compared to non-inhibited trials (see top row). B.) Histogram and rose plots illustrating a decrease in phase locking of mPFC single units to dHPC theta oscillations during SOM-inhibited trials (see bottom row) as compared to non-inhibited trials (see top row). C-D.) Cumulative frequency distribution of delta PPC (Pairwise Phase Consistency; Sample ON PPC – Sample OFF PPC) calculated for all single units (left column, black), units that increase in response to SOM inhibition (middle column, green), and units that decrease in response to SOM inhibition (right column, purple). When calculating phase locking of mPFC units to C.) vHPC theta and D.) dHPC theta, the frequency distribution skews towards negative delta PPC values for all units and increasers, but not for decreasers (data in C-H are represented as mean ± SEM; statistical comparisons in this figure between ON and OFF by Wilcoxon matched-pairs signed rank test Bonferroni corrected for multiple comparisons). E.) Histogram and rose plots illustrating an increase in phase locking of mPFC single units to mPFC theta oscillations during SOMinhibited trials (see right column) as compared to non-inhibited trials (see left columns). F.) SOM inhibition leads to a significant increase in phase locking of mPFC units to local mPFC theta oscillations as illustrated by delta PPC (PPC SAMPLE ON – PPC SAMPLE OFF) values that are significantly greater than zero. G.) Histogram and rose plots illustrating a decrease in phase locking of mPFC single units to dHPC theta oscillations during PV-inhibited trials (see bottom row) are compared to non-inhibited trials (see top row). H.) PV inhibition also leads to a significant increase in phase locking of mPFC units to local mPFC theta oscillations which is significantly greater than that seen in SOM-Arch mice when comparing all cells and increasers (comparisons signified by the vertical lines between F and H, * p<0.0001).

