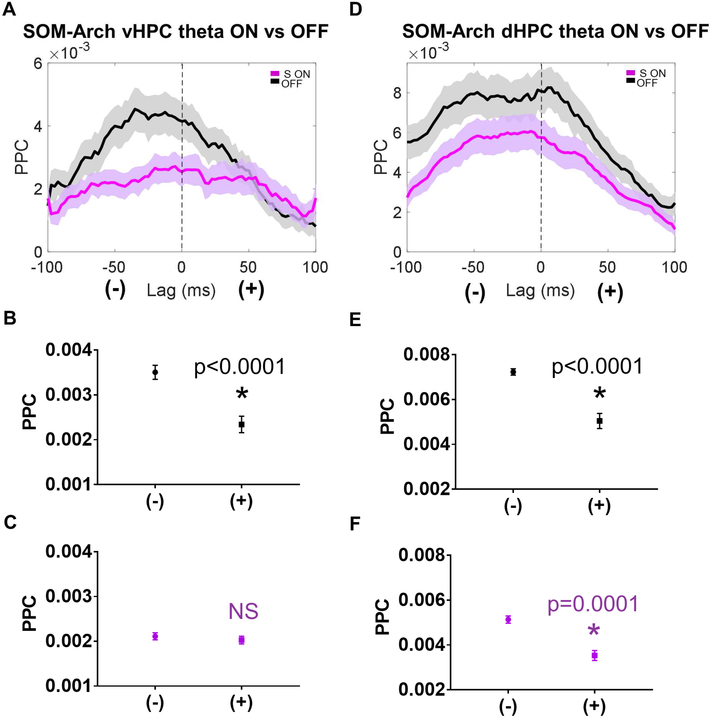
Figure 6: Sample Phase SOM Inhibition impairs vHPC to mPFC Directionality During Long Range Synchronization.
A.) mPFC units exhibit higher phase locking to negative lag vHPC theta as compared to positive lag vHPC theta during the sample phase, but this directionality is abolished by SOM inhibition (dark lines in A and D represent the mean, with the lighter shaded band representing the 95% confidence interval). B.) During the sample phase in OFF trials, the mean PPC at negative lags is significantly greater than the mean PPC at positive lags (data in B-C and E-F are represented as mean ± SEM; statistical comparisons between mean PPC at negative vs positive lags is by Wilcoxon matched-pairs signed rank test Bonferroni corrected for multiple comparisons; * indicates p<0.0001). C.) During the sample phase in SOM-inhibited trials, there is no significant difference between the mean PPC to vHPC theta at negative vs positive lags. D.) mPFC units exhibit higher phase locking to negative lag dHPC theta as compared to positive lag dHPC theta during the sample phase, both during OFF trials and SOM inhibited trials. E.) and F.) During the sample phase in OFF and SOM inhibited trials, the mean PPC to dHPC theta at negative lags is significantly greater than the mean PPC to dHPC theta at positive lags.

