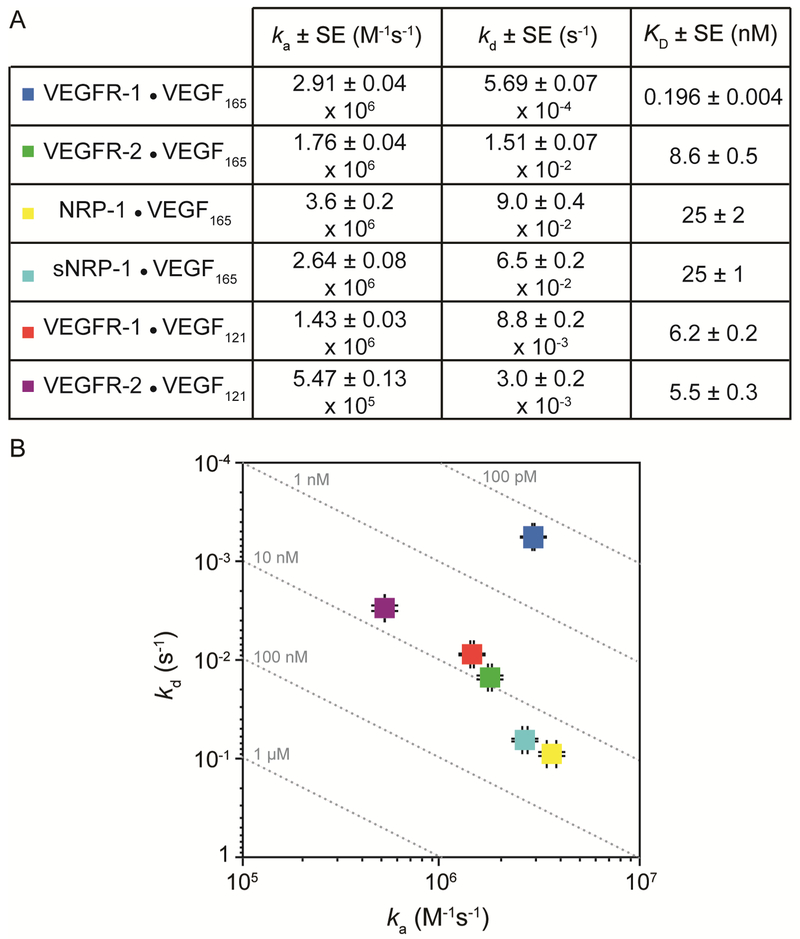
Figure 8. Iso-affinity plot.
(A) Kinetic and equilibrium rate constants derived from binding data. (B) Rate map summarizing binding affinity and kinetics. Dashed lines indicate different combinations of ka and kd that result in the same KD. Data point colors in the graph correspond to the interaction indicated in the Table above.

