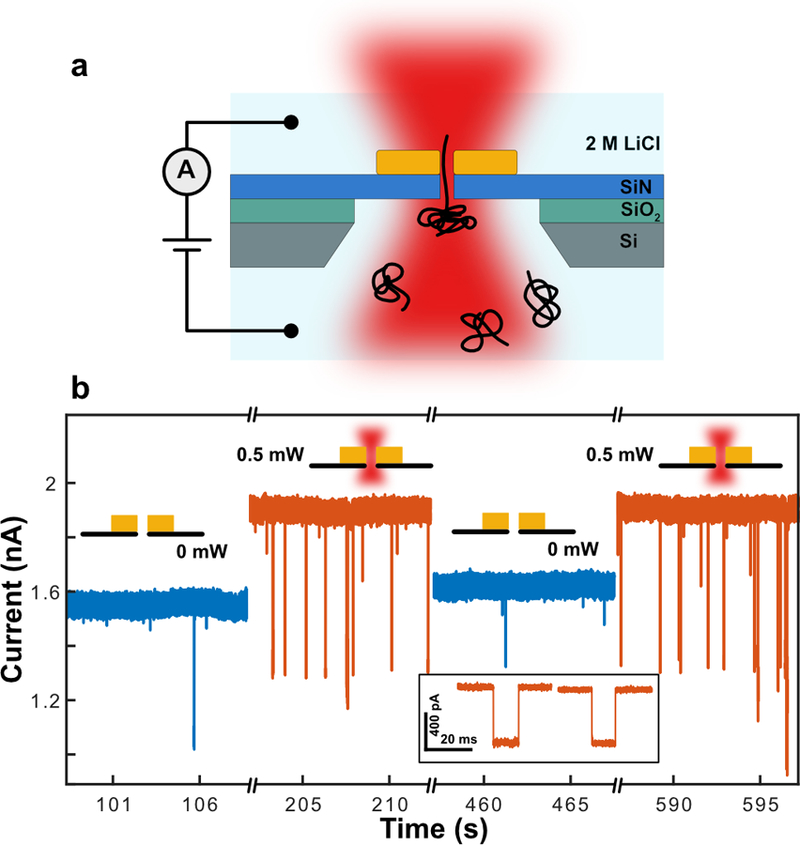
Figure 5. Typical current traces from DNA translocations through plasmonic nanopores with ultra-small nanogaps.

(a) Schematic of the experimental setup for plasmonic nanopore DNA translocation experiments. (b) Typical current traces during a DNA translocation experiment under 100 mV bias voltage without (blue) and with (orange) laser excitation, with 2 zooms of sample translocation events during laser excitation at higher time resolution. 48.5bp λ-DNA was used in the experiment. The current trace is low-pass filtered at 10kHz. A corresponding scatter plot is shown in Supplementary Figure S6.
