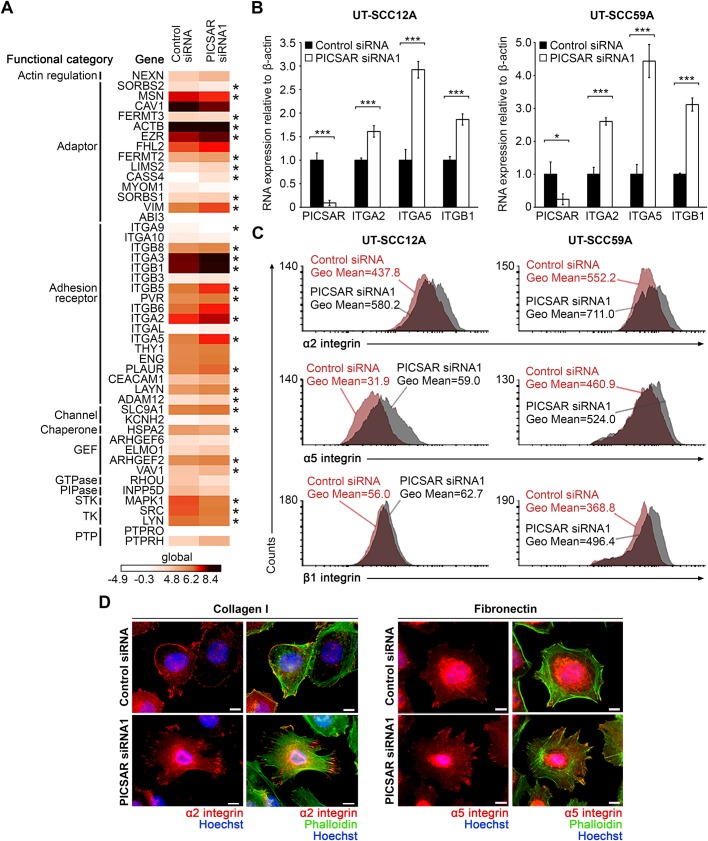
Fig. 2.
Knockdown of PICSAR increases integrin expression in cSCC cells. (A) Three cSCC cell lines (UT-SCC12A, UT-SCC59A, and UT-SCC118) were transfected with PICSAR siRNA (siRNA1) or control siRNA. After 72 h of transfection, whole transcriptome analysis was performed with RNA-seq. Heatmap showing several cell adhesion related genes regulated by PICSAR knockdown (FC log 2>0.5). GEF, guanine nucleotide exchange factor; PIPase, phosphatidylinositol phosphatase; STK, serine/threonine specific protein kinase; TK, tyrosine kinase; PTP, protein tyrosine phosphatase; *P<0.05. (B) Levels of PICSAR and α2, α5 and β1 integrin mRNAs were determined with qPCR in PICSAR knockdown UT-SCC12A and UT-SCC59A cells (n=3). Mean±s.d. is shown. *P<0.05, ***P<0.001; two-tailed t-test. (C) Flow cytometry was performed to measure α2, α5 and β1 integrin expression on the cell surface in PICSAR knockdown UT-SCC12A and UT-SCC59A cells. (D) UT-SCC12A cells were transfected with PICSAR siRNA or control siRNA and plated on collagen I or fibronectin. Cells were fixed and stained with primary antibodies against α2 or α5 integrins (red), Alexa Fluor® 488 conjugated phalloidin (green) and Hoechst (blue). Scale bars: 10 µm.

