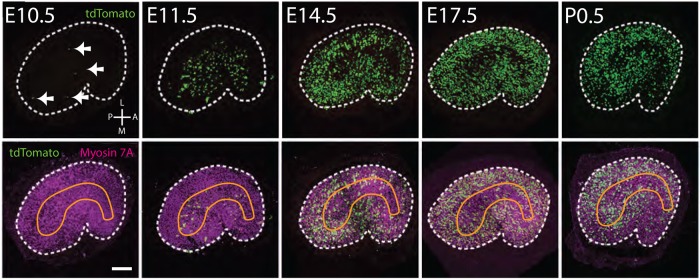
Fig. 2.
HCs develop in a central-to-peripheral gradient. Whole mount images of utricles from adult Atoh1creErt2;R26RtdTomato mice injected with Tamoxifen at the indicated gestational ages. Cells that expressed Atoh1+ on the day of injection are marked in green and all HCs (Myosin7A+) are in magenta. Boundaries of the utricular sensory epithelium are indicated by dashed lines in each panel. The approximate position of the striola is indicated in orange in the lower row. The average number of Atoh1+ cells labeled at E10.5 is low (8 per utricle) and those cells are scattered in the central posterior region (arrows). Induction at later time points indicates a central-to-peripheral gradient of addition of HCs. Orientation for all images is indicated in the upper left panel. Scale bar: 100 µm.

