Fig. 3.
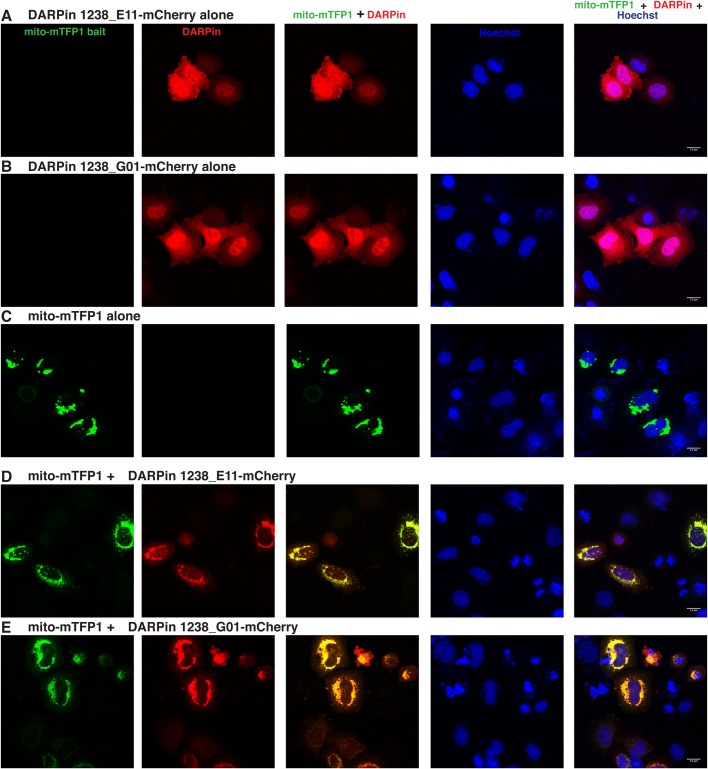
Intracellular binding of anti-mTFP1-DARPins. Confocal images of HeLa cells transiently transfected with (A) pCMV-DARPin 1238_E11-mCherry alone, (B) pCMV-DARPin 1238_G01-mCherry alone, (C) pMITO-mTFP1 alone, (D) the combination of pMITO-mTFP1 and pCMV-DARPin 1238_E11-mCherry and (E) pMITO-mTFP1 and pCMV-DARPin 1238_G01-mCherry. The first column represents the mTFP1 channel (green), the second column is the mCherry channel (red), the third column is the overlay of the two channels, showing the mitochondrial co-localization (resulting in yellow) of the mito-mTFP1 bait with the respective DARPin, the fourth column represents the nuclear Hoechst staining (blue) and the fifth column is the merge of all three channels. Images were taken 24 h post transfection. Transfected constructs are indicated on top of each row and the single channels are indicated inside the panels of the first row. The merge channels are also indicated at the top of the respective columns. The figures are from a representative experiment, performed at least three times. Scale bars: 15 µm.

