Fig 1.
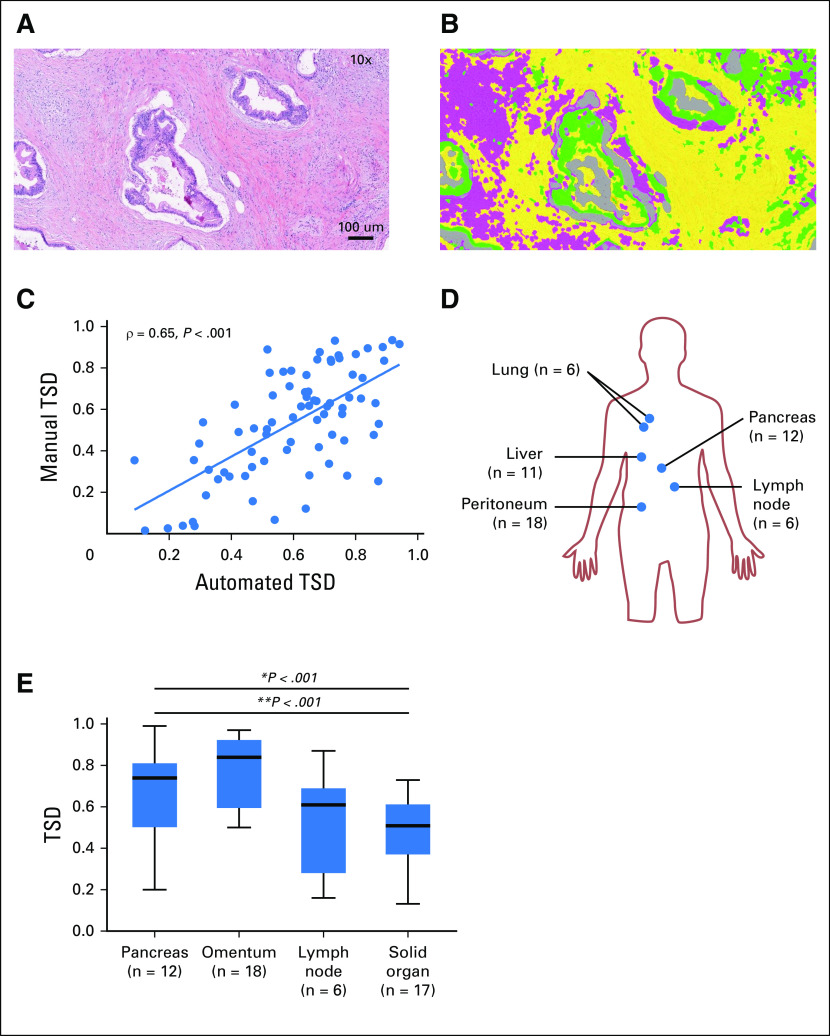
Automated quantification of pancreatic adenocarcinoma (PDA) tumor stroma density at primary and metastatic sites. (A) Resected PDA specimen with hematoxylin and eosin staining (magnification, ×10). (B) Automated segmentation of tumor epithelium (green) and tumor stroma: fibrosis-high stroma (yellow) and fibrosis-low stroma (pink) (magnification, ×10). (C) Tumor stroma density (TSD) was manually quantified on a subset of 77 specimens that also underwent automated TSD quantification with good correlation (ρ = 0.65; P < .001). (D) Distribution of metastatic samples: primary tumors (n = 12), lymph node metastasis (n = 6), omental metastasis (n = 18), and solid organ (liver, n = 11; lung, n = 6). (E) Box-and-whisker plot of TSD across primary and metastatic organ sites; omental metastases had the highest TSD (median, 0.85; range, 0.20 to 0.99), followed by primary tumors (median, 0.74; range, 0.50 to 0.97), lymph node (median, 0.61; range, 0.16 to 0.87), and solid-organ metastases (median, 0.51; range, 0.13 to 0.73). *P < .001. In paired analysis comparing TSD in primary tumors versus metastatic sites, primary tumors showed a significantly higher TSD compared with solid-organ metastases (**P < .001).

