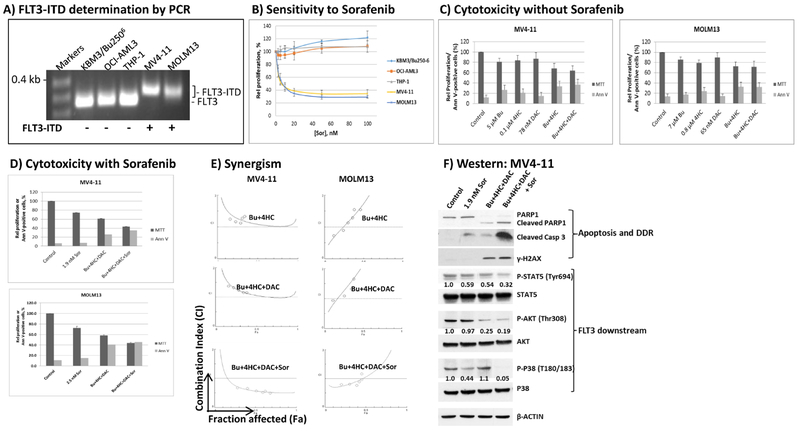
Figure 6.
Effect of FLT3-ITD status on the response of AML cell lines to cytotoxic drug treatments. Genomic DNA was isolated from FLT3 wild type (KBM3/Bu2506, OCI-AML3 and THP1) and FLT3-ITD-positive AML cell lines (MV4-11 and MOLM13) and used as template for PCR analysis. PCR products were resolved on 2% agarose gel with ethidium bromide staining (A). The sensitivity of the five AML cell lines to Sor was compared by analyzing cell proliferation using MTT assay (B). The cytotoxicity of [Bu+4HC+DAC] in the absence (C) or presence (D) of Sor was determined in FLT3-ITD cells. Drug synergism (E) was analyzed as in Figure 1. Western blot analysis (F) shows increased cleavage of PARP1 and caspase 3 and phosphorylation of H2AX, and decreased levels of FLT3 downstream targets, when Sor was combined with [Bu+4HC+DAC]. The levels of phosphorylated proteins were first normalized to their non-phosphorylated forms, and the ratio of the normalized phosphoprotein level relative to the untreated control was calculated. All cells were exposed to drug(s) for 48 hrs (B-F). Results are representatives of two (A, E, F) or average±SD of three (B-D) independent experiments. Bu, busulfan; 4HC, 4-hydroperoxycyclophosphamide; DAC, decitabine; Sor, sorafenib.

