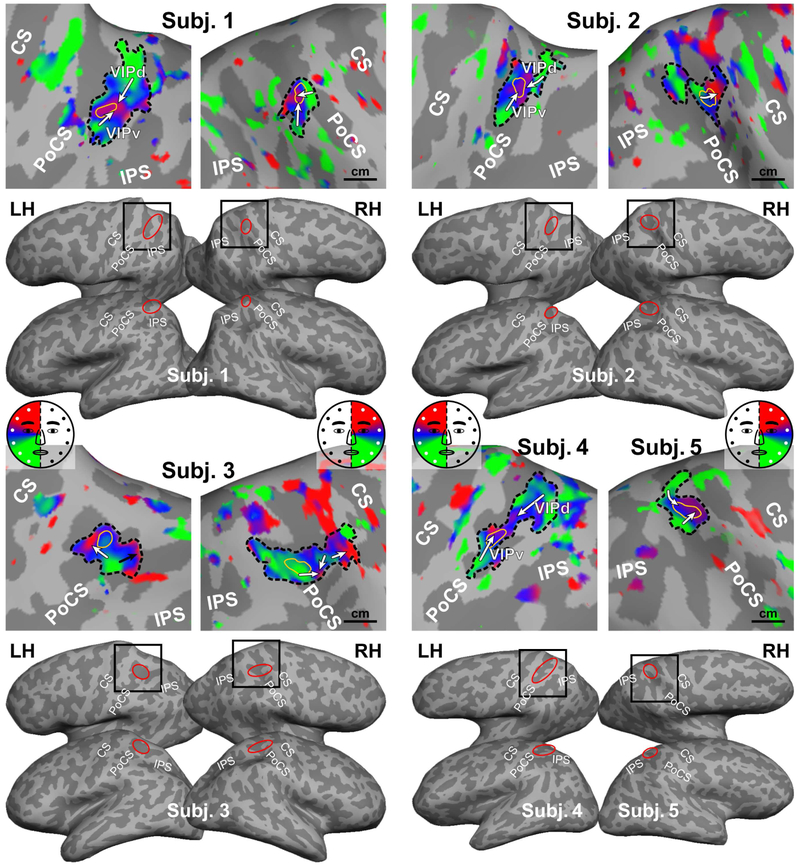
Figure 2.
Somatotopic maps of five subjects in Experiment 1. All maps were rendered with the same statistical threshold (F2230 = 3.035, p = 0.05, uncorrected). Black box: location of each close-up map on the dorsal-lateral cortical surface; Red ellipse: location of the parietal face area on each cortical surface; Dashed black contour: an sROI of the parietal face area; Thin yellow contour: the peak activation region within an sROI; A white or black arrow: a lower-to-upper progression of the contralateral hemiface representation (see color wheel); CS: central sulcus; PoCS: postcentral sulcus; IPS: intraparietal sulcus; LH/RH: left/right hemisphere.

