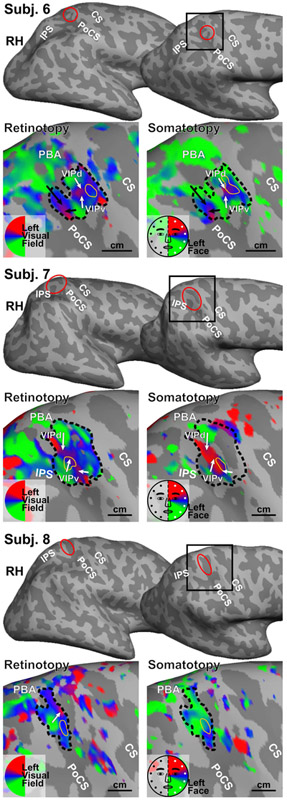
Figure 3.
Retinotopic and somatotopic maps of three subjects in Experiment 2. All maps were rendered with the same statistical threshold (F2, 230 = 3.035, p = 0.05, uncorrected). Each sROI is outlined in the retinotopic map and then superimposed on the somatotopic map. PBA: parietal body areas. Other conventions as in Fig. 2.

