
Figure 3.
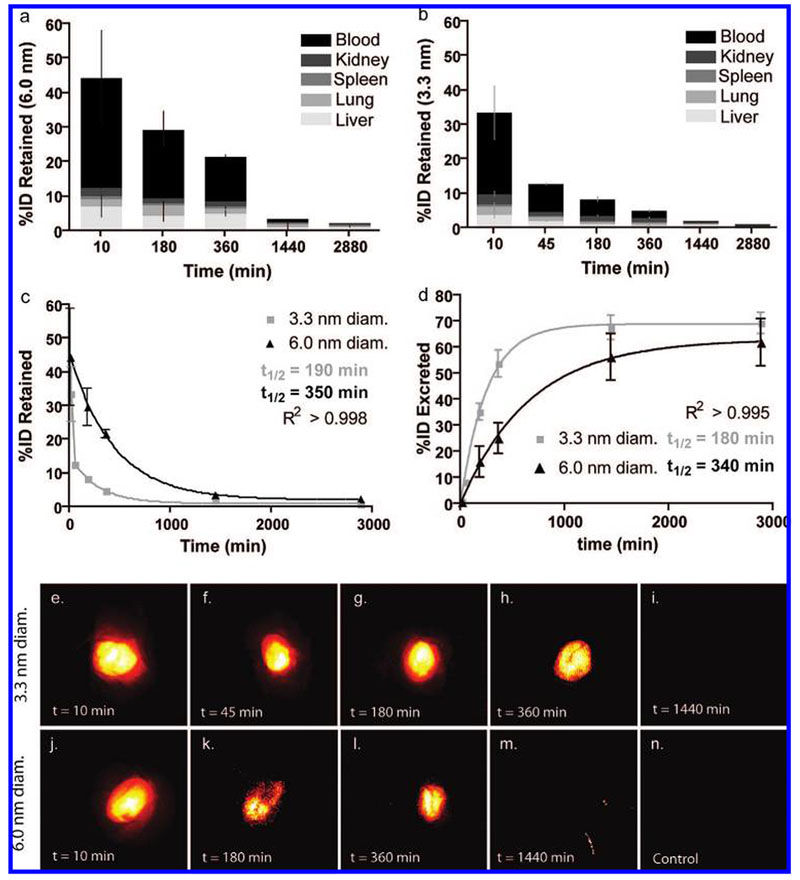
Particle retention and excretion and near-infrared fluorescence imaging. (a, b) Percent of initial particle dose (%ID) retained by blood (black) and tissues: liver (light gray), lung (mid-low gray), spleen (midgray), and kidney (mid-high gray) for 6.0 nm (a) and 3.3 nm (b) diameter C dots at various time points from 10 min to 48 h postinjection (n = 3 mice, mean ± standard deviation). (c) Plot of retained particle concentration for 3.3 nm (light gray) and 6.0 nm (black) diameter C dots and the associated logarithmic decay fits and half-lives. (d) Plot of estimated particle excretion for 3.3 nm (light gray) and 6.0 nm (black) diameter dots and the associated logarithmic fits and half-lives (mean ± standard deviation, n = 9 (three mice, three technical replicates per time point)). (e–i) Pseudocolor images of Cy5 fluorescence (demixed) in intact mouse bladders showing the accumulation of 3.3 nm diameter dots over the course of the first 6 h postinjection (e–h), followed by the negligible particle fluorescence seen at 24 h postinjection (i).(j–m) Pseudocolor images of Cy5 fluorescence (demixed) in intact mouse bladders showing the accumulation of 6.0 nm diameter dots in the first 6 h postinjection (j–l) and at the 24 h end point (m). (n) Pseudocolor image of a control mouse bladder. Further fluorescence and anatomical brightfield images can be found in the Supporting Information, Figures 2 and 3.