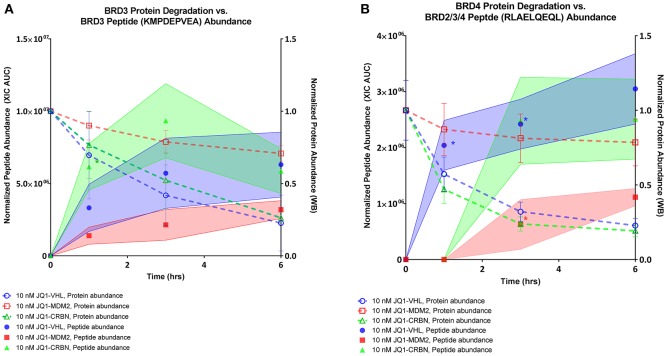
Figure 6.
BRD peptide presentation, 10 nM PROTAC compounds. (A) Relative abundance of BRD3 peptide KMPDEPVEA over a 6 h time course across all 3 PROTAC treatments overlaid with relative abundance of BRD3 protein as assessed by western blot. (B) Relative abundance of BRD2/3/4 peptide RLAELQEQL over a 6 h time course across all 3 PROTAC treatments overlaid with relative abundance of BRD4 protein as assessed by western blot. Shaded regions of peptide abundance curves are standard deviation over multiple replicates (2–6 replicates). Peptide abundance data (XIC AUC) and exact number of replicates is supplied in Table S5. Western blot data is plotted as the mean over three replicates, +/– SD. *indicates single observation, with average experimental error applied.

