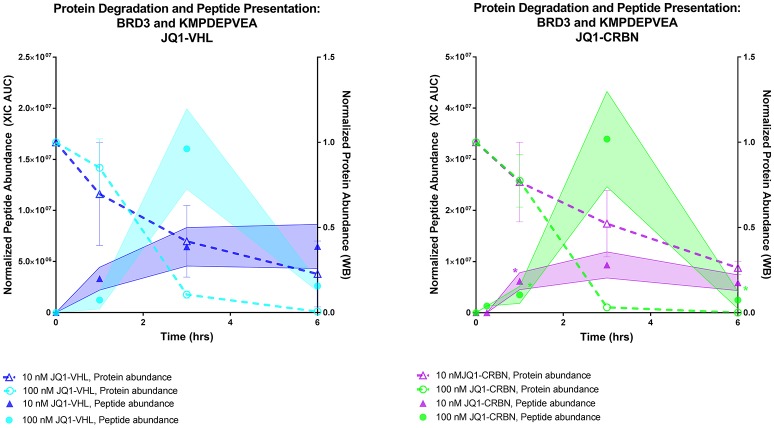
Figure 7.
Comparing protein degradation and peptide presentation for BRD3 using different PROTAC concentrations. BRD3 protein degradation (Right Y axis, both plots) was measured by western blot.Protein degradation was measured using either 10 nM or 100 nM of either JQ1-VHL or JQ1-CRBN treatment over a 6 h time course. BRD3 peptide KMPDEPVEA presentation (Left Y axis) after treatment with10 or 100 nM JQ1-VHL or JQ1-CRBN treatment is shown. Peptide abundance data (XIC AUC) and number of replicates is supplied in Table S5. *indicates single observation, with average experimental error applied.

