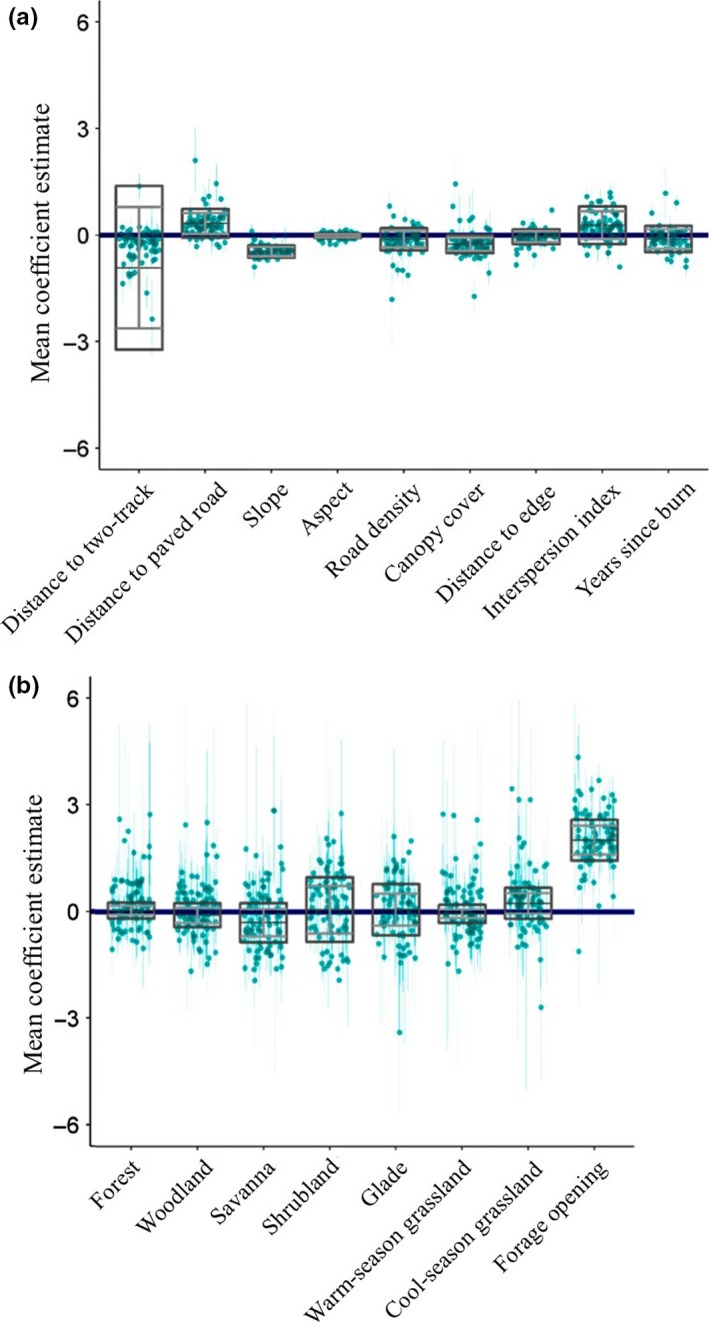
Figure 2.

The individual‐level RSF parameter estimates (green dots) with 95% Bayesian credible intervals (CIs) for reintroduced elk in the Missouri Ozarks (2011–2014). The total number of parameters are divided between panels (a) and (b). Also included are the population‐level random effects distributions (boxes). The middle horizontal bars within the boxes are the point estimates of the mean hyperparameters of the random effects distributions, the gray horizontal bars are the standard deviation of the hyperparameters, and the ends of the boxes represent 95% Bayesian credible intervals on the mean + SD point estimates
