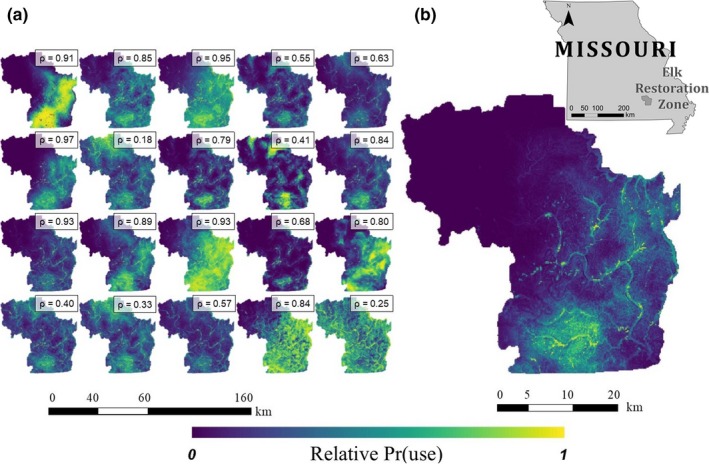
Figure 3.

The spatial maps of the predicted relative probabilities of use for 20 randomly selected individual elk (a) reintroduced to the Missouri Ozarks (2011–2014) compared to the population‐level RSF (b). Spearman rank correlations (ρ; see Table 1) between each individual‐level prediction and the population‐level prediction are also shown
