Figure 5.

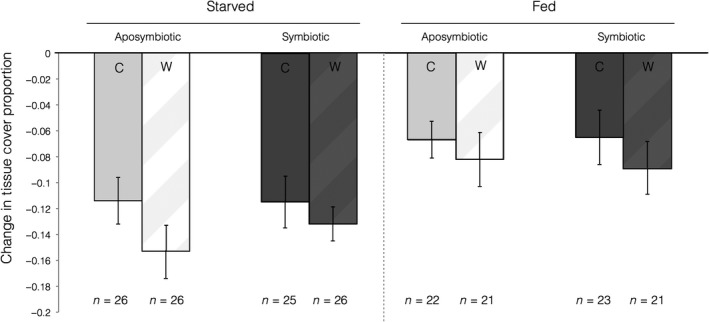
Mean proportional change in total colony tissue cover proportion after 60 days for control (C) and wounded (W) fed and starved colonies of different symbiont states (aposymbiotic, symbiotic). Error bars signify standard error

Mean proportional change in total colony tissue cover proportion after 60 days for control (C) and wounded (W) fed and starved colonies of different symbiont states (aposymbiotic, symbiotic). Error bars signify standard error